POS-Softwaremarkt – Erkenntnisse aus globaler und regionaler Analyse – Prognose bis 2031
Historische Daten : 2021-2022 | Basisjahr : 2023 | Prognosezeitraum : 2023-2031Marktgröße und Prognose für POS-Software (2021 – 2031), Berichtsabdeckung zu globalen und regionalen Anteilen, Trends und Wachstumschancen: Nach Komponente (Software und Dienste); Bereitstellungstyp (vor Ort und in der Cloud); Anwendung (Bestandsverfolgung, Einkaufsmanagement, Verkaufsberichte, Kundenbindung und andere); Endbenutzer (Einzelhandel, Gastgewerbe, Medien und Unterhaltung, Gesundheitswesen und andere) und Geografie
- Status : Veröffentlichte Daten
- Berichtscode : TIPRE00007898
- Kategorie : Technologie, Medien und Telekommunikation
- Anzahl der Seiten : 150
- Verfügbare Berichtsformate :


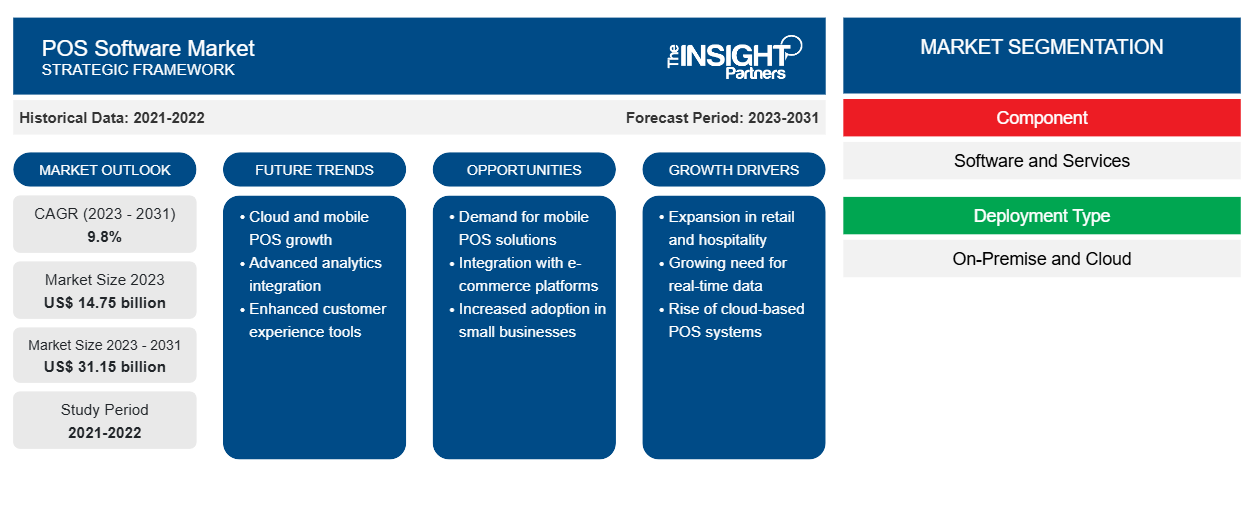
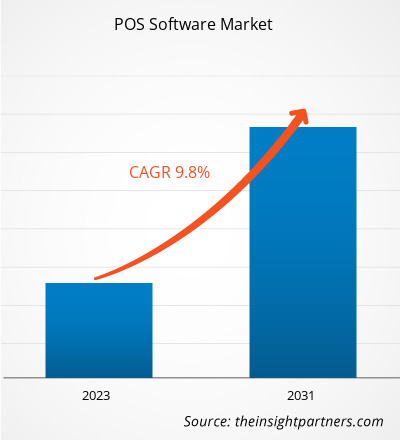
Das Marktvolumen für POS- Software soll von 14,75 Milliarden US-Dollar im Jahr 2023 auf 31,15 Milliarden US-Dollar im Jahr 2031 anwachsen. Von 2023 bis 2031 wird eine durchschnittliche jährliche Wachstumsrate (CAGR ) von 9,8 % erwartet. Die zunehmende Nutzung von Cloud-Computing-Diensten dürfte ein wichtiger Trend auf dem POS- Softwaremarkt bleiben.
Marktanalyse für POS -Software
Die Notwendigkeit, bargeldlose Transaktionen durchzuführen, Verkaufs- und Bestandsdaten zu verfolgen und Analysen zu nutzen, um die Verkaufsstrategie in Einzelhandelsketten, Restaurants, Hotels, Drogerien, Autowerkstätten und anderen Orten zu optimieren, hat die Nachfrage nach Point-of-Sale-Software ( POS ) angetrieben. Es wird erwartet, dass die Verwendung von POS -Software in einer Vielzahl von Branchen aufgrund der steigenden Nachfrage nach erweiterten Funktionen wie Kundendatenverwaltung, Bestandsverfolgung, Verkaufsüberwachung, Mitarbeiterverwaltungsanalyse und Berichterstellung zunehmen wird. Darüber hinaus könnte die steigende Nachfrage nach cloudbasierter mobiler Point-of-Sale-Software auf die wachsende Akzeptanz cloudbasierter Lösungen zurückzuführen sein.
Marktübersicht für POS -Software
Point-of-Sale-Software ( POS ) ist eine spezielle Anwendung, die Unternehmen zur Durchführung von Transaktionen an der Verkaufsstelle verwenden, typischerweise im Einzelhandel. Indem sie Verkäufe nachverfolgt, Lagerbestände kontrolliert und Zahlungen abwickelt, beschleunigt sie den Bezahlvorgang. Um Genauigkeit zu gewährleisten, wird Point-of-Sale-Software häufig mit Hardware wie Barcode- Lesegeräten , Registrierkassen und Kartenlesern verbunden. Darüber hinaus verfügt sie über Tools zur Handhabung von Kundeninformationen, zur Erstellung von Verkaufsberichten und zur Auswertung.
Passen Sie diesen Bericht Ihren Anforderungen an
Sie erhalten kostenlos individuelle Anpassungen an jedem Bericht, einschließlich Teilen dieses Berichts oder einer Analyse auf Länderebene, eines Excel-Datenpakets sowie tolle Angebote und Rabatte für Start-ups und Universitäten.
POS- Softwaremarkt: Strategische Einblicke
-
Holen Sie sich die wichtigsten Markttrends aus diesem Bericht.Dieses KOSTENLOSE Beispiel umfasst eine Datenanalyse von Markttrends bis hin zu Schätzungen und Prognosen.
Treiber und Chancen auf dem POS- Softwaremarkt
Wachsende E-Commerce-Branche
Angesichts der zunehmenden Verbreitung von Online- und Omnichannel -Shopping benötigen Unternehmen Point-of-Sale-Software ( POS ), die ihre Offline- und Online-Vertriebskanäle nahtlos miteinander verbinden kann. Dies treibt die Nachfrage nach Point-of-Sale-Systemen ( POS ) voran, die Funktionen wie Bestandskontrolle, Auftragsabwicklung und Kundenbeziehungsmanagement ( CRM ) umfassen, was wiederum das Wachstum des POS- Softwaremarktes vorantreibt.
Steigende Nachfrage nach Business Intelligence und Data Analytics
Point-of-Sale-Software ( POS ) wird von Unternehmen zunehmend als Tool verwendet, um Daten zu Verkäufen, Kundenverhalten, Lagerbeständen und Mitarbeiterleistung zu sammeln und zu untersuchen. Ausgefeilte Analyse- und Berichtstechnologien können Unternehmen dabei helfen, datengesteuerte Entscheidungen zu treffen, die Kundenzufriedenheit zu erhöhen und den Arbeitsaufwand zu reduzieren. Daher wird erwartet, dass diese Vorteile der POS -Software das Marktwachstum im Prognosezeitraum vorantreiben werden .
Segmentierungsanalyse des POS-Software-Marktberichts
Wichtige Segmente, die zur Ableitung der POS-Software-Marktanalyse beigetragen haben, sind Komponente (Software und Dienste); Bereitstellungstyp (vor Ort und in der Cloud); Anwendung und Endbenutzer
- Basierend auf den Komponenten ist der POS-Softwaremarkt in Software und Dienstleistungen unterteilt. Das Softwaresegment hatte im Jahr 2023 einen größeren Marktanteil.
- Basierend auf der Bereitstellungsart ist der Markt in On-Premise und Cloud unterteilt. Das On-Premise-Segment hatte im Jahr 2023 einen größeren Marktanteil.
- Basierend auf der Anwendung ist der Markt in Bestandsverfolgung, Einkaufsmanagement, Verkaufsberichte, Kundenbindung und andere unterteilt. Das Segment Bestandsverfolgung hatte im Jahr 2023 einen größeren Marktanteil.
- Nach Endverbraucher ist der Markt in Einzelhandel, Gastgewerbe, Medien und Unterhaltung, Gesundheitswesen und andere segmentiert. Das Einzelhandelssegment hielt im Jahr 2023 den größten Marktanteil.
Marktanteilsanalyse für POS-Software nach geografischer Lage
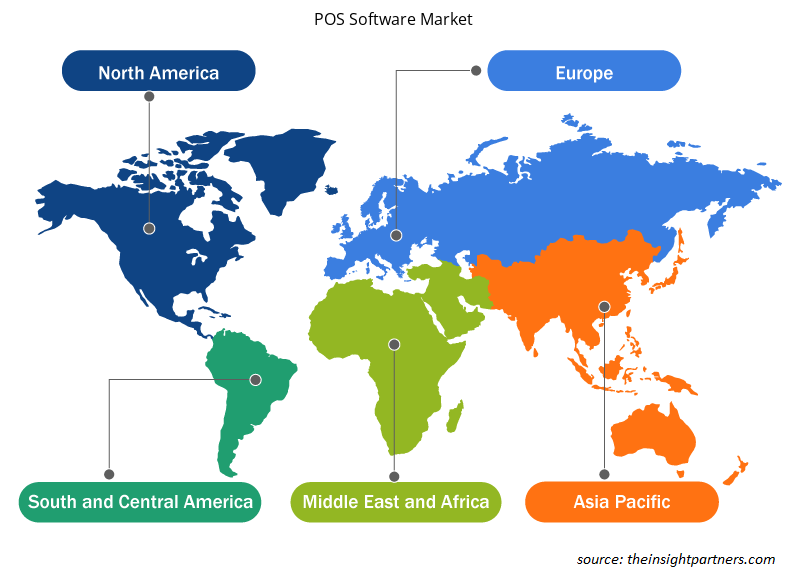
Der geografische Umfang des POS-Software-Marktberichts ist hauptsächlich in fünf Regionen unterteilt:Nordamerika, Asien-Pazifik, Europa, Naher Osten und Afrika sowie Südamerika/Süd- und Mittelamerika.
In Bezug auf den Umsatz hatte Nordamerika den größten Marktanteil im Bereich POS-Software. Der Markt in dieser Region ist in die USA, Kanada und Mexiko unterteilt. In der Region gibt es eine Reihe bekannter Hersteller von POS-Software sowie eine hohe Nachfrage nach komplexer integrierter POS-Software. Darüber hinaus erlebt der Einzelhandel in der Region ein enormes Wachstum, was das Wachstum des Marktes ankurbelt. Darüber hinaus wird erwartet, dass die US-Gesundheitsbranche aufgrund der Notwendigkeit, die Krankenhauseinrichtungen in Bezug auf Versicherung, Zahlung und Patientenmanagement zu modernisieren, am schnellsten wächst.
Neuigkeiten und aktuelle Entwicklungen zum POS-Softwaremarkt
Der POS-Softwaremarkt wird durch die Erfassung qualitativer und quantitativer Daten nach Primär- und Sekundärforschung bewertet, die wichtige Unternehmensveröffentlichungen, Verbandsdaten und Datenbanken umfasst. Im Folgenden finden Sie eine Liste der Entwicklungen auf dem Markt für Sprach- und Sprechstörungen und -strategien:
- US Bank, ein Branchenführer im Bereich Zahlungsdienste, hat die Einführung von Avvance angekündigt, einer eingebetteten, mehrkanaligen Point-of-Sale-Kreditlösung. Avvance ermöglicht Unternehmen, Verbraucherfinanzierungen während des Bezahlvorgangs mit einer schnellen Beantragung und sofortiger Entscheidung anzubieten. (Quelle: Elavon Inc., Pressemitteilung, 2023)
- NCR Corporation hat NCR Aloha Cloud vorgestellt, eine cloudbasierte Point-of-Sale-Lösung (POS), die robust genug ist, um unter der branchenführenden Marke Aloha auf den Markt zu kommen. Aloha Cloud bietet eine aktualisierte Benutzeroberfläche (UI), das kleinste Handheld-Gerät auf dem Markt und eine nahtlose Zahlungsabwicklung mit Einzahlungsbegleichung am nächsten Tag, sodass die Betreiber mehr Zeit haben, sich auf den Betrieb ihres Restaurants zu konzentrieren. (Pressemitteilung, 2022)
Regionale Einblicke in den POS-Softwaremarkt
Die regionalen Trends und Faktoren, die den POS-Softwaremarkt im Prognosezeitraum beeinflussen, wurden von den Analysten von Insight Partners ausführlich erläutert. In diesem Abschnitt werden auch die Marktsegmente und die Geografie von POS-Software in Nordamerika, Europa, im asiatisch-pazifischen Raum, im Nahen Osten und Afrika sowie in Süd- und Mittelamerika erörtert.
- Erhalten Sie regionale Daten zum POS-Softwaremarkt
Umfang des POS-Software-Marktberichts
| Berichtsattribut | Details |
|---|---|
| Marktgröße im Jahr 2023 | 14,75 Milliarden US-Dollar |
| Marktgröße bis 2031 | 31,15 Milliarden US-Dollar |
| Globale CAGR (2023 - 2031) | 9,8 % |
| Historische Daten | 2021-2022 |
| Prognosezeitraum | 2023–2031 |
| Abgedeckte Segmente |
Nach Komponente
|
| Abgedeckte Regionen und Länder |
Nordamerika
|
| Marktführer und wichtige Unternehmensprofile |
|
Dichte der Marktteilnehmer für POS-Software: Die Auswirkungen auf die Geschäftsdynamik verstehen
Der Markt für POS-Software wächst rasant. Dies wird durch die steigende Nachfrage der Endnutzer aufgrund von Faktoren wie sich entwickelnden Verbraucherpräferenzen, technologischen Fortschritten und einem größeren Bewusstsein für die Vorteile des Produkts vorangetrieben. Mit der steigenden Nachfrage erweitern Unternehmen ihr Angebot, entwickeln Innovationen, um die Bedürfnisse der Verbraucher zu erfüllen, und nutzen neue Trends, was das Marktwachstum weiter ankurbelt.
Die Marktteilnehmerdichte bezieht sich auf die Verteilung der Firmen oder Unternehmen, die in einem bestimmten Markt oder einer bestimmten Branche tätig sind. Sie gibt an, wie viele Wettbewerber (Marktteilnehmer) in einem bestimmten Marktraum im Verhältnis zu seiner Größe oder seinem gesamten Marktwert präsent sind.
Die wichtigsten auf dem POS-Softwaremarkt tätigen Unternehmen sind:
- Infor Inc
- Intuit, Inc.
- Lichtgeschwindigkeit
- Oracle Corporation
- Clover Network, LLC
- NCR Corporation
Haftungsausschluss : Die oben aufgeführten Unternehmen sind nicht in einer bestimmten Reihenfolge aufgeführt.
- Überblick über die wichtigsten Akteure auf dem POS-Softwaremarkt
Abdeckung und Ergebnisse des POS-Software-Marktberichts
Der Bericht „Marktgröße und Prognose für POS-Software (2023–2031)“ bietet eine detaillierte Analyse des Marktes, die die folgenden Bereiche abdeckt:
- Marktgröße und Prognose auf globaler, regionaler und Länderebene für alle wichtigen Marktsegmente, die im Rahmen des Projekts abgedeckt sind
- Marktdynamik wie Treiber, Beschränkungen und wichtige Chancen
- Wichtige Zukunftstrends
- Detaillierte PEST/Porters Five Forces- und SWOT-Analyse
- Globale und regionale Marktanalyse mit wichtigen Markttrends, wichtigen Akteuren, Vorschriften und aktuellen Marktentwicklungen
- Branchenlandschaft und Wettbewerbsanalyse, einschließlich Marktkonzentration, Heatmap-Analyse, prominenten Akteuren und aktuellen Entwicklungen
- Detaillierte Firmenprofile

Ankita ist eine dynamische Marktforschungs- und Beratungsexpertin mit über 8 Jahren Erfahrung in den Bereichen Technologie, Medien, IKT sowie Elektronik und Halbleiter. Sie hat über 100 Beratungs- und Forschungsaufträge für globale Kunden wie Microsoft, Oracle, NEC Corporation, SAP, KPMG und Expeditors International erfolgreich geleitet und durchgeführt. Zu ihren Kernkompetenzen gehören Marktbewertung, Datenanalyse, Prognose, Strategieformulierung, Wettbewerbsbeobachtung und das Verfassen von Berichten. Ankita ist versiert in der Abwicklung kompletter Projektzyklen – von der Angebotserstellung vor dem Verkauf und Kundengesprächen bis hin zur Bereitstellung umsetzbarer Erkenntnisse nach dem Verkauf. Sie ist versiert in der Leitung funktionsübergreifender Teams, der Strukturierung komplexer Forschungsmodule und der Ausrichtung von Lösungen an kundenspezifischen Geschäftszielen. Ihre ausgezeichneten Kommunikationsfähigkeiten, Führungsqualitäten und Präsentationsfähigkeiten haben es ihr ermöglicht, in einem schnelllebigen und sich entwickelnden Marktumfeld stets wertorientierte Ergebnisse zu liefern.
- Historische Analyse (2 Jahre), Basisjahr, Prognose (7 Jahre) mit CAGR
- PEST- und SWOT-Analyse
- Marktgröße Wert/Volumen – Global, Regional, Land
- Branchen- und Wettbewerbslandschaft
- Excel-Datensatz
Erfahrungsberichte
Der SCADA-Systemmarktbericht von Insight Partners ist umfassend und bietet wertvolle Einblicke in aktuelle Trends und Zukunftsprognosen. Das Team war durchweg hochprofessionell, reaktionsschnell und hilfsbereit. Wir sind sehr zufrieden und können die Dienstleistungen wärmstens empfehlen.
RAN KEDEM Partner, Reali Technologies LTDsIch habe einen Bericht über einen sehr spezifischen Softwaremarkt angefordert, und das Team hat ihn innerhalb weniger Tage erstellt. Die Informationen waren sehr relevant und gut präsentiert. Anschließend habe ich einige Änderungen und Ergänzungen zum Bericht angefordert. Das Team reagierte erneut sehr schnell, und ich erhielt den Abschlussbericht in weniger als einer Woche.
JEAN-HERVE JENN Vorsitzende, Future AnalyticaWir haben mit The Insight Partners für eine wichtige Marktstudie und Prognose zusammengearbeitet. Sie gaben uns klare Einblicke in Chancen und Risiken, die uns bei der Gestaltung unserer Pläne halfen. Ihre Recherchen waren benutzerfreundlich und basierten auf soliden Daten. Sie halfen uns, kluge und sichere Entscheidungen zu treffen. Wir können sie wärmstens empfehlen.
PIYUSH NAGPAL Sr. Vizepräsident, Fernlicht GlobalDie Insight Partners lieferten aufschlussreiche, gut strukturierte Marktforschung mit fundierter Fachkompetenz. Ihr Team war durchweg professionell und reaktionsschnell. Die benutzerfreundliche Website ermöglichte den Zugriff auf Branchenberichte. Wir empfehlen sie wärmstens für zuverlässige und hochwertige Forschungsdienstleistungen.
YUKIHIKO ADACHI Geschäftsführer, Deep Blue, LLC.Dies ist das erste Mal, dass ich einen Marktbericht von The Insight Partners erworben habe. Obwohl ich zunächst unsicher war, besuchte ich die Website und fühlte mich dann sicherer, das Risiko einzugehen und einen Marktbericht zu kaufen. Ich bin mit der Qualität des Berichts und dem Kundenservice rundum zufrieden. Ich hatte einige Fragen und Anmerkungen zum ersten Bericht, aber nach einigen E-Mail-Gesprächen mit dem Analysten bin ich überzeugt, dass ich einen Bericht habe, den ich als Input für unseren strategischen Planungsprozess verwenden kann. Vielen Dank, dass Sie sich die Zeit genommen und dies zu einer positiven Erfahrung gemacht haben. Ich werde Ihren Service auf jeden Fall weiterempfehlen und Sie werden meine erste Anlaufstelle sein, wenn wir weitere Marktdaten benötigen.
JOHN SUZUKI Präsident und Chief Executive Officer, Vorstandsmitglied, BK TechnologiesIch möchte mich für Ihre Unterstützung und die Professionalität bedanken, die Sie bei der Bearbeitung meiner Informationsanfrage zum IVD-Markt für Infektionskrankheiten in Nigeria gezeigt haben. Ich schätze Ihre Geduld, Ihre Beratung und die Tatsache, dass Sie bereit waren, einen Rabatt anzubieten, der uns schließlich den Abschluss eines Geschäfts ermöglichte. Ich freue mich darauf, The Insight Partners in Zukunft wieder zu beauftragen, dank des Eindrucks, den Sie bei dieser ersten Begegnung bei mir hinterlassen haben.
DR. CHIJIOKE ONYIA GESCHÄFTSFÜHRERIN, PineCrest Healthcare Ltd.Grund zum Kauf
- Fundierte Entscheidungsfindung
- Marktdynamik verstehen
- Wettbewerbsanalyse
- Kundeneinblicke
- Marktprognosen
- Risikominimierung
- Strategische Planung
- Investitionsbegründung
- Identifizierung neuer Märkte
- Verbesserung von Marketingstrategien
- Steigerung der Betriebseffizienz
- Anpassung an regulatorische Trends


Exklusive Berichtsrabatte freischalten
Jetzt anfragen


 Kostenlose Probe anfordern für - Markt für POS-Software