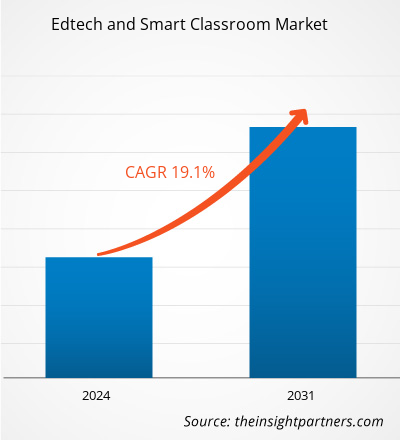
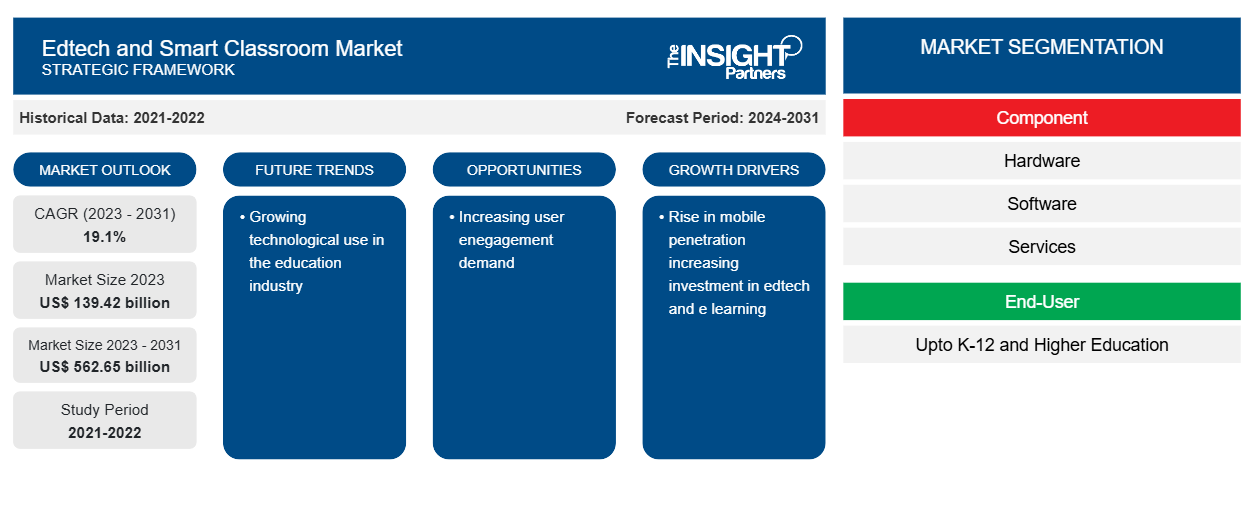
Se espera que el tamaño del mercado de tecnología educativa y aulas inteligentes crezca de 139 420 millones de dólares en 2023 a 562 650 millones de dólares en 2031; se estima que crecerá a una CAGR del 19,1 % entre 2023 y 2031. Es probable que el creciente uso de la tecnología en la industria de la educación siga siendo una tendencia clave en el mercado de tecnología educativa y aulas inteligentes.
Análisis del mercado de la tecnología educativa y las aulas inteligentes
Los sistemas de TI, especialmente las plataformas basadas en la nube, son más importantes que nunca debido al creciente énfasis en la planificación digital de lecciones y el aprendizaje remoto. Potencialmente, la nube es una innovación tecnológica que fomenta la transformación de sus usuarios. Mediante el uso de servidores distantes, redes, sistemas de bases de datos, análisis, sistemas de almacenamiento , software y otros recursos digitales, la computación en la nube es un paradigma de tecnología de la información que proporciona servicios informáticos a través de Internet. Para la educación superior, la computación en la nube ofrece ventajas sustanciales, especialmente para los estudiantes universitarios de K-12. Los educadores pueden realizar fácilmente lecciones virtuales e incluir a sus alumnos en diversas tareas y programas en línea aprovechando la computación en la nube en el aula. Por lo tanto, el uso creciente de lecciones virtuales está impulsando el crecimiento del mercado de la tecnología educativa y las aulas inteligentes .
Descripción general del mercado de tecnología educativa y aulas inteligentes
La nube es la tecnología más utilizada debido a sus métodos de almacenamiento y uso adaptables, sus sólidas características de seguridad y su simplicidad de uso. Los educadores pueden aprovechar la nube para el aprendizaje en línea de bajo costo, el intercambio de archivos y el almacenamiento de archivos masivos en una variedad de formatos. Debido a esto, casi todas las empresas de tecnología educativa y las organizaciones educativas prefieren el uso de la nube. El aprendizaje a través de la gamificación es otra moda inventiva. En cuanto a la tecnología educativa , los métodos educativos convencionales son laboriosos y necesitan una intensa concentración en la gamificación; sin embargo, convierten el aprendizaje en una tarea agradable. A través de la gamificación, los estudiantes pueden competir con un cronómetro o entre ellos, ver su progreso en tiempo real en las tablas de clasificación y recibir premios por las puntuaciones altas. Para los usuarios de hoy, esto ha aumentado la emoción y el disfrute del aprendizaje. Muchas empresas importantes han utilizado la gamificación como una tendencia de marketing en respuesta a esta tendencia de la tecnología educativa y las aulas inteligentes.
Personalice este informe según sus necesidades
Obtendrá personalización en cualquier informe, sin cargo, incluidas partes de este informe o análisis a nivel de país, paquete de datos de Excel, así como también grandes ofertas y descuentos para empresas emergentes y universidades.
-
Obtenga las principales tendencias clave del mercado de este informe.Esta muestra GRATUITA incluirá análisis de datos, desde tendencias del mercado hasta estimaciones y pronósticos.
Impulsores y oportunidades del mercado de la tecnología educativa y las aulas inteligentes and Smart Classroom Market Drivers and Opportunities
El aumento de la penetración móvil favorece el crecimiento del mercado
La penetración de la telefonía móvil es mayor entre las personas con ingresos más bajos. AT&T ha ofrecido 100 millones de dólares para proporcionar conectividad móvil y dispositivos a 50.000 estudiantes en zonas rurales y de bajos ingresos, según Saperstein. India, el segundo país más poblado del mundo, con 18.000 millones de personas (Banco Mundial), podría superar a China y convertirse en el país más poblado en 2024 (Informe de la ONU).
Además, la India tiene una de las poblaciones más jóvenes, con casi el 30% de la población de la India entre 18 y 34 años y 260 millones de niños en edad escolar. En 2022, según el informe Project Tomorrow, el 33% de los estudiantes de secundaria y el 31% de los estudiantes de secundaria y primaria de EE. UU. tienen dispositivos móviles proporcionados por la escuela. Como resultado del uso generalizado de dispositivos móviles, la gamificación , las aulas virtuales y el aprendizaje electrónico están en aumento, lo que impulsa el crecimiento del mercado de la tecnología educativa y las aulas inteligentes.
Informe de mercado de tecnología educativa y aulas inteligentes Análisis de segmentación
Los segmentos clave que contribuyeron a la derivación del análisis del mercado de tecnología educativa y aulas inteligentes son los componentes y el usuario final.
- Según los componentes, el mercado de tecnología educativa y aulas inteligentes se segmenta en hardware, software y servicios.
- En función de los usuarios finales, el mercado de tecnología educativa y aulas inteligentes se segmenta en educación primaria y secundaria y superior.
Análisis de la cuota de mercado de la tecnología educativa y las aulas inteligentes por geografía
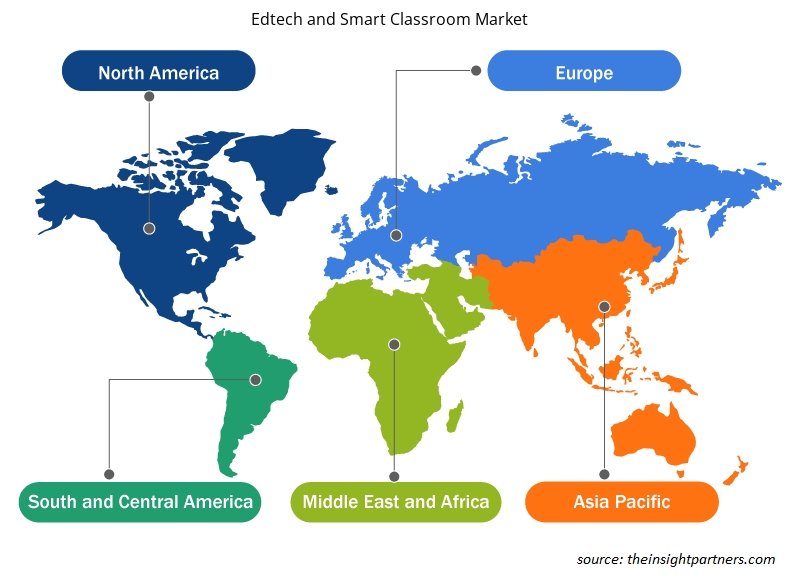
- El mercado de la tecnología educativa y las aulas inteligentes está segmentado en cinco regiones principales: América del Norte, Europa, Asia Pacífico (APAC), Oriente Medio y África (MEA) y América del Sur y Central. Se prevé que Asia Pacífico crezca con la CAGR más alta durante el período de pronóstico.
- En los últimos años, China ha realizado importantes inversiones en infraestructura de TIC y recursos educativos, lo que ha impulsado la integración de la tecnología en la educación. En China, el aprendizaje en línea ha ganado popularidad en los últimos años. Los usuarios de eLearning son cada vez más frecuentes. Por ejemplo, la zona ofrece una serie de sistemas de eLearning, incluido el aprendizaje en línea, VIPKid y una plataforma educativa que ofrece lecciones individuales de inglés a niños chinos de entre 4 y 15 años. Desde la década de 1990, cuando surgió el eLearning por primera vez, el gobierno ha puesto mucho énfasis en su desarrollo debido a la ejecución de muchas políticas. Como resultado, la zona ha logrado mucho en el campo del eLearning, lo que está impulsando el crecimiento del mercado de la tecnología educativa y las aulas inteligentes.
Perspectivas regionales del mercado de tecnología educativa y aulas inteligentes
Los analistas de Insight Partners explicaron en detalle las tendencias y los factores regionales que influyen en el mercado de tecnología educativa y aulas inteligentes durante el período de pronóstico. Esta sección también analiza los segmentos y la geografía del mercado de tecnología educativa y aulas inteligentes en América del Norte, Europa, Asia Pacífico, Oriente Medio y África, y América del Sur y Central.

- Obtenga datos regionales específicos para el mercado de tecnología educativa y aulas inteligentes
Alcance del informe sobre el mercado de tecnología educativa y aulas inteligentes
| Atributo del informe | Detalles |
|---|---|
| Tamaño del mercado en 2023 | US$ 139,42 mil millones |
| Tamaño del mercado en 2031 | US$ 562,65 mil millones |
| CAGR global (2023 - 2031) | 19,1% |
| Datos históricos | 2021-2022 |
| Período de pronóstico | 2024-2031 |
| Segmentos cubiertos |
Por componente
|
| Regiones y países cubiertos |
América del norte
|
| Líderes del mercado y perfiles de empresas clave |
|
Densidad de actores del mercado de tecnología educativa y aulas inteligentes: comprensión de su impacto en la dinámica empresarial
El mercado de tecnología educativa y aulas inteligentes está creciendo rápidamente, impulsado por la creciente demanda de los usuarios finales debido a factores como la evolución de las preferencias de los consumidores, los avances tecnológicos y una mayor conciencia de los beneficios del producto. A medida que aumenta la demanda, las empresas amplían sus ofertas, innovan para satisfacer las necesidades de los consumidores y aprovechan las tendencias emergentes, lo que impulsa aún más el crecimiento del mercado.
La densidad de actores del mercado se refiere a la distribución de las empresas o firmas que operan dentro de un mercado o industria en particular. Indica cuántos competidores (actores del mercado) están presentes en un espacio de mercado determinado en relación con su tamaño o valor total de mercado.
Las principales empresas que operan en el mercado de tecnología educativa y aulas inteligentes son:
- Compañía Apple Inc.
- Pizarra Inc.
- Sistemas Cisco, Inc.
- Corporación D2L
- Corporación IBM
- Grupo Lenovo Limitado
Descargo de responsabilidad : Las empresas enumeradas anteriormente no están clasificadas en ningún orden particular.

- Obtenga una descripción general de los principales actores clave del mercado de tecnología educativa y aulas inteligentes
Noticias y desarrollos recientes del mercado de tecnología educativa y aulas inteligentes
El mercado de seguros entre pares se evalúa mediante la recopilación de datos cualitativos y cuantitativos posteriores a la investigación primaria y secundaria, que incluye publicaciones corporativas importantes, datos de asociaciones y bases de datos. A continuación, se incluye una lista de los avances en el mercado de la tecnología educativa y las aulas inteligentes:
- En julio de 2022, Blackboard Inc. anunció el lanzamiento del nivel de informes para la plataforma Blackboard Data, que proporcionará a las instituciones informes orientados a brindar percepciones sobre el uso de herramientas de aprendizaje dentro del ecosistema Blackboard SaaS EdTech.
(Fuente: Blackboard Inc, comunicado de prensa)
- En septiembre de 2022, Cisco lanzó Webex Classrooms, que conecta de forma segura a profesores, estudiantes y padres en una sola área, independientemente de su ubicación física.
(Fuente: Cisco, Nota de prensa)
Informe sobre el mercado de tecnología educativa y aulas inteligentes: cobertura y resultados
El informe "Tamaño y pronóstico del mercado de tecnología educativa y aulas inteligentes (2021-2031)" proporciona un análisis detallado del mercado que cubre las áreas mencionadas a continuación:
- Tamaño del mercado y pronóstico a nivel global, regional y nacional para todos los segmentos clave del mercado cubiertos bajo el alcance
- Dinámica del mercado, como impulsores, restricciones y oportunidades clave
- Principales tendencias futuras
- Análisis detallado de las cinco fuerzas de Porter y PEST y FODA
- Análisis del mercado global y regional que cubre las tendencias clave del mercado, los principales actores, las regulaciones y los desarrollos recientes del mercado.
- Análisis del panorama de la industria y de la competencia que abarca la concentración del mercado, el análisis de mapas de calor, los actores destacados y los desarrollos recientes
- Perfiles detallados de empresas
- Análisis histórico (2 años), año base, pronóstico (7 años) con CAGR
- Análisis PEST y FODA
- Tamaño del mercado, valor/volumen: global, regional y nacional
- Industria y panorama competitivo
- Conjunto de datos de Excel
Informes recientes
Testimonios
Razón para comprar
- Toma de decisiones informada
- Comprensión de la dinámica del mercado
- Análisis competitivo
- Información sobre clientes
- Pronósticos del mercado
- Mitigación de riesgos
- Planificación estratégica
- Justificación de la inversión
- Identificación de mercados emergentes
- Mejora de las estrategias de marketing
- Impulso de la eficiencia operativa
- Alineación con las tendencias regulatorias


 Obtenga una muestra gratuita para - Mercado de tecnología educativa y aulas inteligentes