Mercado de agua con gas: mapeo competitivo y perspectivas estratégicas para 2031
Datos históricos : 2021-2022 | Año base : 2023 | Período de pronóstico : 2024-2031Tamaño y pronóstico del mercado de agua con gas (2021-2031), participación global y regional, tendencias y análisis de oportunidades de crecimiento. Cobertura del informe: por categoría (natural y con sabor), tipo de empaque (botellas y latas), canal de distribución (supermercados e hipermercados, tiendas de conveniencia, comercio minorista en línea y otros) y geografía.
- Estado : Datos publicados
- Código de informe : TIPRE00015123
- Categoría : Alimentos y bebidas
- Número de páginas : 150
- Formatos de informe disponibles :


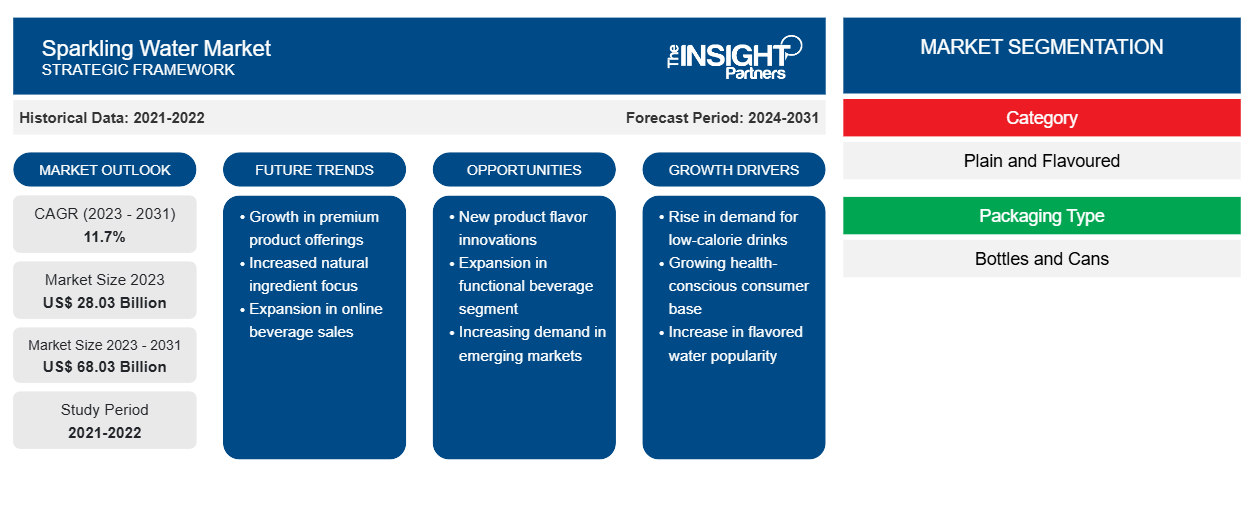
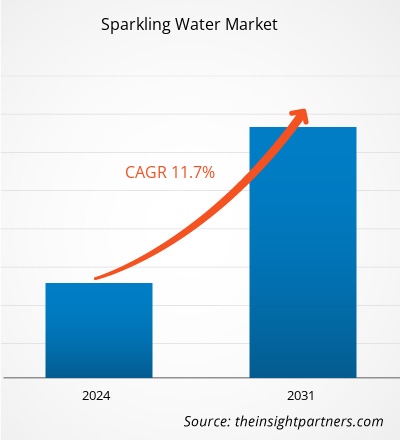
Se proyecta que el tamaño del mercado de agua con gas alcance los 68.030 millones de dólares en 2031, frente a los 28.030 millones de dólares en 2023. Se espera que el mercado registre una CAGR del 11,7 % entre 2023 y 2031. Es probable que la creciente popularidad del agua con gas entre los millennials siga siendo una de las tendencias clave del mercado de agua con gas.
Análisis del mercado del agua con gas
Los diversos beneficios para la salud asociados al agua con gas están impulsando el crecimiento del mercado de esta bebida. Con la creciente tendencia de adoptar un estilo de vida saludable entre todos los grupos de edad, los consumidores están cambiando progresivamente a bebidas saludables e innovadoras, incluida el agua con gas, especialmente como una alternativa a los refrescos y las bebidas carbonatadas azucaradas. Esto está aumentando el tamaño del mercado del agua con gas. Según Nestlé, una empresa de alimentos y bebidas con sede en Suiza, aproximadamente el 64% de los consumidores prefieren bebidas funcionales sin calorías añadidas. Además, la mayoría de los consumidores jóvenes están optando cada vez más por el agua con gas en lugar del agua normal, principalmente debido a su preferencia por los sabores.
Panorama del mercado del agua con gas
El agua con gas es una de las alternativas preferidas a los refrescos, como las gaseosas y los zumos. El agua con gas se produce cuando se le añade dióxido de carbono al agua bajo presión, lo que la hace similar a los refrescos, pero con menos calorías. Se presenta en categorías simples y con sabor, con edulcorantes y azúcar añadidos. El agua con gas mantiene a la persona hidratada y proporciona beneficios para el control del peso. Las investigaciones también indican que el agua con gas mejora la digestión y ayuda a aliviar el estreñimiento. Actualmente, el agua con gas está ganando popularidad debido a sus beneficios para la salud y a su menor contenido calórico en comparación con otros refrescos.
Personalice este informe según sus necesidades
Obtendrá personalización en cualquier informe, sin cargo, incluidas partes de este informe o análisis a nivel de país, paquete de datos de Excel, así como también grandes ofertas y descuentos para empresas emergentes y universidades.
Mercado de agua con gas: perspectivas estratégicas
-
Obtenga las principales tendencias clave del mercado de este informe.Esta muestra GRATUITA incluirá análisis de datos, desde tendencias del mercado hasta estimaciones y pronósticos.
Factores impulsores y oportunidades del mercado del agua con gas
Número creciente de lanzamientos de nuevos productos
Los fabricantes están lanzando variedades de bebidas innovadoras para reducir los niveles de azúcar añadido y mejorar la experiencia general del consumidor. En marzo de 2021, la marca estadounidense Perrier de Nestlé anunció Energize, agua con gas con cafeína. Con ello, la empresa ha presentado su línea inicial de bebidas energéticas carbonatadas. Además, en mayo de 2021, PepsiCo lanzó Soulboost, una bebida de agua con gas mejorada elaborada con zumo real e ingredientes funcionales. Además, para satisfacer la creciente demanda, los fabricantes están intentando lanzar nuevas variantes de productos con cafeína. Por tanto, las continuas innovaciones de productos de las principales empresas de agua con gas están captando la atención de los consumidores, impulsando así el crecimiento del mercado del agua con gas.PepsiCo launched Soulboost, an enhanced sparkling water beverage made with real juice and functional ingredients. Also, to satisfy the growing demands, manufacturers are trying to launch new product variants with caffeine in it. Therefore, the continuous product innovations by key sparkling water companies are grabbing the attention of consumers, thus propelling the sparkling water market growth.
Aumento del consumo en el hogar
Durante los primeros meses de la pandemia de COVID-19, la mayoría de las oficinas y lugares públicos estuvieron cerrados, lo que provocó una caída sustancial en la demanda comercial de agua con gas. Sin embargo, las órdenes generalizadas de aislamiento domiciliario debido a COVID-19 han impulsado la demanda de varios tipos de agua embotellada , incluida el agua con gas, entre los hogares. El cambio en el comportamiento de compra de los consumidores también es uno de los factores importantes que impulsan las ventas a través del canal en línea. Por lo tanto, un aumento en el consumo en el hogar está creando oportunidades lucrativas para el crecimiento de los actores del mercado del agua con gas.
Análisis de segmentación del informe de mercado de agua con gas
Los segmentos clave que contribuyeron a la derivación del análisis del mercado de agua con gas son la categoría, el tipo de empaque y el canal de distribución.
- Según la categoría, el mercado del agua con gas se segmenta en agua natural y agua con sabor. El segmento de agua con sabor tuvo una mayor participación de mercado en 2023.
- Por tipo de envase, el mercado se segmenta en botellas y latas. El segmento de latas tuvo una mayor participación en el mercado en 2023.
- En términos de canal de distribución, el mercado está segmentado en supermercados e hipermercados, tiendas de conveniencia, venta minorista en línea, entre otros. El segmento de supermercados e hipermercados tuvo una mayor participación del mercado en 2023.
Análisis de la cuota de mercado del agua con gas por geografía
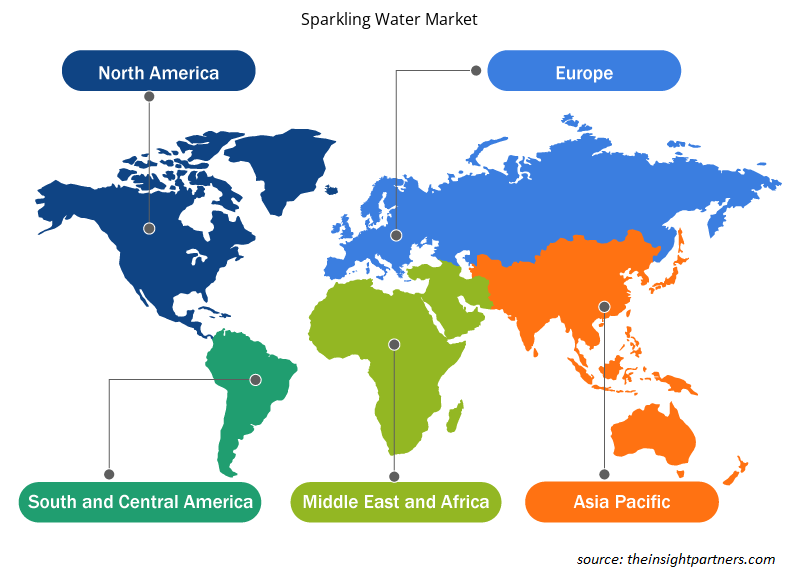
El alcance geográfico del informe del mercado de agua con gas se divide principalmente en cinco regiones: América del Norte, Asia Pacífico, Europa, Medio Oriente y África, y América del Sur y Central.
La región de Asia Pacífico tiene una mayor participación en el mercado mundial. América del Norte también es uno de los principales contribuyentes al crecimiento del mercado mundial de agua con gas. En América del Norte, el mercado de agua con gas se encuentra actualmente en la fase de crecimiento y experimenta un crecimiento exponencial. Con la creciente tendencia a llevar un estilo de vida saludable entre todos los grupos de edad, la población de América del Norte está cambiando gradualmente hacia bebidas saludables e innovadoras, incluida el agua con gas. Es probable que el mercado esté impulsado por la creciente preferencia de los consumidores por el agua con gas en lugar del agua con gas y las bebidas carbonatadas azucaradas.
Perspectivas regionales del mercado del agua con gas
Los analistas de Insight Partners explicaron en detalle las tendencias y los factores regionales que influyen en el mercado del agua con gas durante el período de pronóstico. Esta sección también analiza los segmentos y la geografía del mercado del agua con gas en América del Norte, Europa, Asia Pacífico, Oriente Medio y África, y América del Sur y Central.
- Obtenga los datos regionales específicos para el mercado de agua con gas
Alcance del informe sobre el mercado del agua con gas
| Atributo del informe | Detalles |
|---|---|
| Tamaño del mercado en 2023 | US$ 28.03 mil millones |
| Tamaño del mercado en 2031 | US$ 68.03 mil millones |
| CAGR global (2023 - 2031) | 11,7% |
| Datos históricos | 2021-2022 |
| Período de pronóstico | 2024-2031 |
| Segmentos cubiertos |
Por categoría
|
| Regiones y países cubiertos |
América del norte
|
| Líderes del mercado y perfiles de empresas clave |
|
Densidad de actores del mercado: comprensión de su impacto en la dinámica empresarial
El mercado del agua con gas está creciendo rápidamente, impulsado por la creciente demanda de los usuarios finales debido a factores como la evolución de las preferencias de los consumidores, los avances tecnológicos y una mayor conciencia de los beneficios del producto. A medida que aumenta la demanda, las empresas amplían sus ofertas, innovan para satisfacer las necesidades de los consumidores y aprovechan las tendencias emergentes, lo que impulsa aún más el crecimiento del mercado.
La densidad de actores del mercado se refiere a la distribución de las empresas o firmas que operan dentro de un mercado o industria en particular. Indica cuántos competidores (actores del mercado) están presentes en un espacio de mercado determinado en relación con su tamaño o valor total de mercado.
Las principales empresas que operan en el mercado de agua con gas son:
- PepsiCo
- Estar protegido
- Fiscal General Barr
- Compañía de agua Crystal Geyser
- Lluvia parlante
- Corporación Nacional de Bebidas.
Descargo de responsabilidad : Las empresas enumeradas anteriormente no están clasificadas en ningún orden particular.
- Obtenga una descripción general de los principales actores clave del mercado de agua con gas
Noticias y novedades del mercado del agua con gas
El mercado del agua con gas se evalúa mediante la recopilación de datos cualitativos y cuantitativos a partir de una investigación primaria y secundaria, que incluye publicaciones corporativas importantes, datos de asociaciones y bases de datos. A continuación, se incluye una lista de los avances en el mercado del agua con gas y las estrategias:
- PepsiCo, la empresa líder en alimentos y bebidas, acaba de lanzar su última innovación, Soulboost, una bebida de agua con gas con un toque de jugo real e ingredientes funcionales. Soulboost captura la diversión de una bebida afrutada a través de un refresco de agua con gas ligero y sin culpa. Sus dos variedades, Lift y Ease, ofrecen cuatro deliciosos sabores y solo entre 10 y 20 calorías por lata de 12 oz. (Fuente: Cision US Inc, sitio web de la empresa/comunicado de prensa/2021)
- Perrier, una marca de Nestlé SA, Vevey, Suiza, se expandió al mercado de bebidas energéticas carbonatadas con su último lanzamiento: Perrier Energize. El agua mineral efervescente de Francia obtiene su cafeína de extractos de café verde orgánico y yerba mate. (Fuente: BNP Media., Sitio web de la empresa/ Artículos /2021)
- Keurig Dr Pepper adquirió la marca de agua con gas con cafeína Limitless, con sede en Chicago. Los términos del acuerdo no fueron revelados. (Fuente: Industry Dive, sitio web de la empresa/Noticias/2020)
Informe sobre el mercado del agua con gas: cobertura y resultados
El informe “Tamaño y pronóstico del mercado de agua con gas (2021-2031)” proporciona un análisis detallado del mercado que cubre las siguientes áreas:
- Tamaño del mercado y pronóstico a nivel global, regional y nacional para todos los segmentos clave del mercado cubiertos bajo el alcance
- Dinámica del mercado, como impulsores, restricciones y oportunidades clave
- Principales tendencias futuras
- Análisis detallado de las cinco fuerzas de Porter y FODA
- Análisis del mercado global y regional que cubre las tendencias clave del mercado, los principales actores, las regulaciones y los desarrollos recientes del mercado.
- Análisis del panorama de la industria y de la competencia que abarca la concentración del mercado, el análisis de mapas de calor, los actores destacados y los desarrollos recientes
- Perfiles detallados de empresas

- Análisis histórico (2 años), año base, pronóstico (7 años) con CAGR
- Análisis PEST y FODA
- Tamaño del mercado, valor/volumen: global, regional y nacional
- Industria y panorama competitivo
- Conjunto de datos de Excel
Testimonios
El informe de mercado de sistemas SCADA de Insight Partners es completo y ofrece información valiosa sobre las tendencias actuales y las previsiones futuras. El equipo fue altamente profesional, receptivo y me brindó un gran apoyo en todo momento. Estamos muy satisfechos y recomendamos ampliamente sus servicios.
RAN KEDEM Socio, Reali Technologies LTDsSolicité un informe sobre un mercado de software muy específico y el equipo lo elaboró en pocos días. La información era muy relevante y estaba bien presentada. Posteriormente, solicité algunos cambios y adiciones al informe. El equipo fue muy receptivo y recibí el informe final en menos de una semana.
JEAN-HERVE JENN Presidente, Future AnalyticaTrabajamos con The Insight Partners para un importante estudio y pronóstico de mercado. Nos brindaron una visión clara de las oportunidades y los riesgos, lo que nos ayudó a definir nuestros planes. Su investigación fue fácil de usar y se basó en datos sólidos. Nos ayudó a tomar decisiones inteligentes y seguras. Los recomendamos ampliamente.
PIYUSH NAGPAL Vicepresidente Sénior, , High Beam GlobalThe Insight Partners realizó una investigación de mercado profunda y bien estructurada con una sólida experiencia en el sector. Su equipo fue profesional y receptivo en todo momento. El sitio web, fácil de usar, facilitó el acceso a los informes del sector. Los recomendamos ampliamente por sus servicios de investigación confiables y de alta calidad.
YUKIHIKO ADACHI Director Ejecutivo, , Deep Blue, LLCEsta es la primera vez que compro un informe de mercado de The Insight Partners. Aunque al principio tenía dudas, visité su sitio web y me sentí más cómodo al arriesgarme y comprarlo. Estoy completamente satisfecho con la calidad del informe y el servicio al cliente. Tenía varias preguntas y comentarios sobre el informe inicial, pero después de un par de conversaciones por correo electrónico con su analista, creo que tengo un informe que puedo usar como base para nuestro proceso de planificación estratégica. Muchas gracias por tomarse el tiempo y hacer de esta una experiencia positiva. Sin duda, recomendaré sus servicios y serán mi primera opción cuando necesitemos más datos de mercado.
JOHN SUZUKI Presidente y Director Ejecutivo, Director de la Junta Directiva, BK TechnologiesAgradezco su apoyo y la profesionalidad que demostraron al atender mi solicitud de información sobre el mercado de diagnóstico in vitro (IVD) para enfermedades infecciosas en Nigeria. Agradezco su paciencia, su orientación y su disposición a ofrecerme un descuento, lo que finalmente nos permitió cerrar un trato. Espero poder colaborar con The Insight Partners en el futuro, gracias a la impresión que me causó este primer encuentro.
DRA. CHIJIOKE ONYIA, DIRECTORA GENERAL, PineCrest Healthcare Ltd.Razón para comprar
- Toma de decisiones informada
- Comprensión de la dinámica del mercado
- Análisis competitivo
- Información sobre clientes
- Pronósticos del mercado
- Mitigación de riesgos
- Planificación estratégica
- Justificación de la inversión
- Identificación de mercados emergentes
- Mejora de las estrategias de marketing
- Impulso de la eficiencia operativa
- Alineación con las tendencias regulatorias


Desbloquea descuentos exclusivos en informes
Consultar ahora


 Obtenga una muestra gratuita para - Mercado de agua con gas