
Rapport sur le marché de l’authentification sécurisée 3D 2031 par segments, géographie, dynamique, développements récents et informations stratégiques
Analyse de la taille et des prévisions du marché de l'authentification 3D Secure (2021-2031), des parts mondiales et régionales, des tendances et des opportunités de croissance. Couverture du rapport : par composant (solution et services), utilisateur final (banques, commerçants et processeurs de paiement) et géographie.
- Statut : Données publiées
- Code du rapport : TIPRE00021739
- Catégorie : Technologie, médias et télécommunications
- Nombre de pages : 150
- Formats de rapport disponibles :


- Date de dernière mise à jour : July 31, 2024

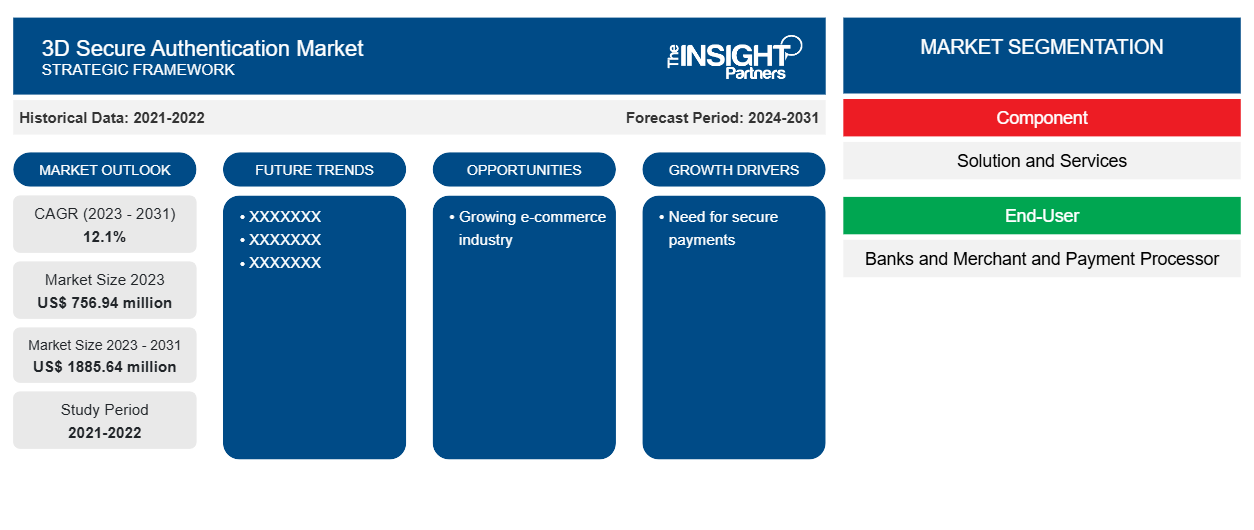
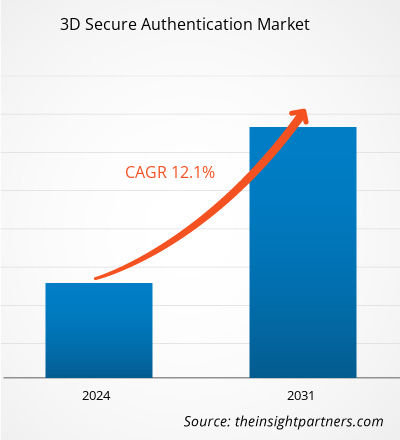
Le marché de l'authentification 3D Secure devrait atteindre 1 885,64 millions de dollars américains d'ici 2031, contre 756,94 millions de dollars américains en 2023. Le marché devrait enregistrer un TCAC de 12,1 % au cours de la période 2023-2031. L'augmentation des transactions en ligne et la multiplication des cyberattaques devraient rester des tendances clés du marché.
Analyse du marché de l'authentification 3D Secure
L'augmentation de la pénétration d'Internet, l'augmentation du revenu disponible des consommateurs et l'adoption croissante de la numérisation sont quelques-uns des facteurs qui stimulent la croissance du marché. L'essor du commerce électronique et du commerce mobile génère une demande de solutions pour sécuriser les transactions, ce qui entraîne une croissance du marché. Avec le nombre croissant de transactions en ligne, les inquiétudes concernant les fraudes en ligne stimulent le marché.
Aperçu du marché de l'authentification 3D Secure
3D Secure (3DS) est une méthode d'authentification et un protocole de sécurité adoptés par les entreprises pour sécuriser leur écosystème de paiement . Il fournit une couche de sécurité supplémentaire pour les transactions par carte de crédit. Ce processus d'authentification vérifie l'identité du client lors du paiement. La réglementation d'authentification stricte PSD2 en Europe et des réglementations similaires au Royaume-Uni, en Inde et en Australie favorisent l'adoption de solutions d'authentification 3D Secure pour les paiements par carte.
Personnalisez ce rapport en fonction de vos besoins
Vous bénéficierez d'une personnalisation gratuite de n'importe quel rapport, y compris de certaines parties de ce rapport, d'une analyse au niveau des pays, d'un pack de données Excel, ainsi que d'offres et de remises exceptionnelles pour les start-ups et les universités.
Marché de l'authentification 3D Secure : informations stratégiques
-
Obtenez les principales tendances clés du marché de ce rapport.Cet échantillon GRATUIT comprendra une analyse de données, allant des tendances du marché aux estimations et prévisions.
Facteurs moteurs et opportunités du marché de l'authentification 3D Secure
Besoin de paiements sécurisés.
Avec la numérisation croissante, les entreprises adoptent des solutions numériques pour gérer efficacement leurs opérations commerciales. Ce facteur conduit à l'adoption de solutions permettant d'effectuer et de collecter des paiements entre les entreprises. La sécurisation de l'écosystème de paiement est la priorité absolue de toute entreprise, car il est important de créer et de maintenir la confiance des clients. Pour cela, les entreprises adoptent des solutions d'authentification 3D Secure pour ajouter une couche de sécurité supplémentaire afin d'empêcher les transactions en ligne non autorisées.
Croissance du secteur du commerce électronique
Le secteur du commerce électronique gagne du terrain en raison de la pénétration croissante d'Internet, des ventes de smartphones et de l'augmentation du pouvoir d'achat des consommateurs. La faisabilité, les prix abordables et la large gamme de produits sont quelques-uns des avantages des achats en ligne par rapport aux achats traditionnels. Par conséquent, les clients sont enclins à effectuer des achats via des plateformes de commerce électronique. Cela a conduit à une augmentation des paiements des clients, ce qui a donné naissance au marché de l'authentification 3D Secure. L'authentification 3D Secure aide les entreprises et les clients à effectuer des transactions en ligne plus sécurisées. L'adoption de cette solution réduit le risque de fraude et offre plus de sécurité avec une couche d'authentification supplémentaire.
Analyse de segmentation du rapport sur le marché de l'authentification sécurisée 3D
Les segments clés qui ont contribué à l’élaboration de l’analyse du marché de l’authentification sécurisée 3D sont le composant et l’utilisateur final.
- En fonction des composants, le marché de l'authentification sécurisée 3D est divisé en solutions et services. Le segment des solutions détenait la plus grande part du marché en 2023.
- En fonction de l'utilisateur final, le marché de l'authentification 3D Secure est segmenté en banques et en commerçants et processeurs de paiement. Le segment des banques détenait une part importante du marché en 2023.
Analyse des parts de marché de l'authentification 3D Secure par zone géographique
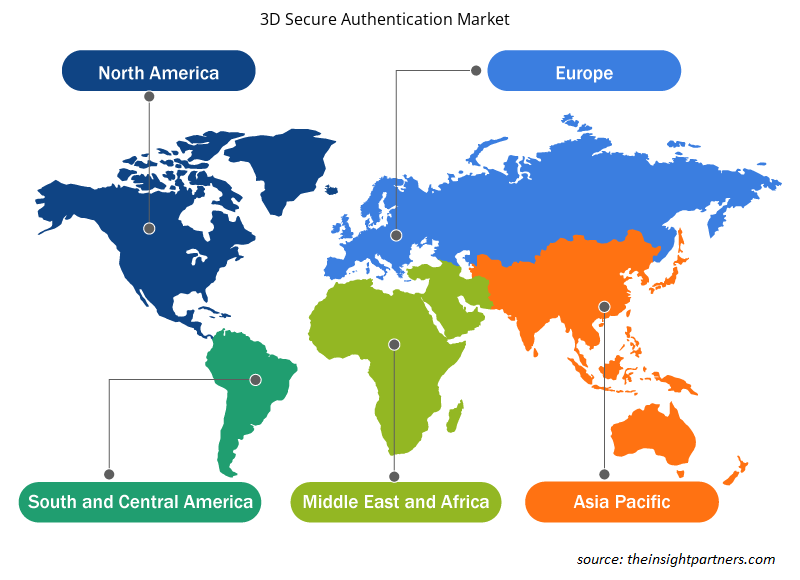
La portée géographique du rapport sur le marché de l’authentification sécurisée 3D est principalement divisée en cinq régions : Amérique du Nord, Asie-Pacifique, Europe, Moyen-Orient et Afrique, et Amérique du Sud et centrale.
La région Asie-Pacifique détient la plus grande part de marché et devrait connaître le taux de croissance annuel composé le plus élevé. Des pays comme l'Inde, le Japon et la Chine détiennent la majorité des parts de marché de la région Asie-Pacifique. L'adoption des technologies numériques alimente la croissance du marché dans la région. Le secteur du commerce électronique en pleine croissance contribue à la croissance du marché de l'authentification 3D Secure.
Aperçu régional du marché de l'authentification 3D Secure
Les tendances et facteurs régionaux influençant le marché de l’authentification 3D Secure tout au long de la période de prévision ont été expliqués en détail par les analystes d’Insight Partners. Cette section traite également des segments et de la géographie du marché de l’authentification 3D Secure en Amérique du Nord, en Europe, en Asie-Pacifique, au Moyen-Orient et en Afrique, ainsi qu’en Amérique du Sud et en Amérique centrale.
- Obtenez les données régionales spécifiques au marché de l'authentification 3D Secure
Portée du rapport sur le marché de l'authentification 3D Secure
| Attribut de rapport | Détails |
|---|---|
| Taille du marché en 2023 | 756,94 millions de dollars américains |
| Taille du marché d'ici 2031 | 1 885,64 millions de dollars américains |
| Taux de croissance annuel composé mondial (2023-2031) | 12,1% |
| Données historiques | 2021-2022 |
| Période de prévision | 2024-2031 |
| Segments couverts |
Par composant
|
| Régions et pays couverts |
Amérique du Nord
|
| Leaders du marché et profils d'entreprises clés |
|
Densité des acteurs du marché de l'authentification 3D Secure : comprendre son impact sur la dynamique des entreprises
Le marché de l'authentification sécurisée 3D connaît une croissance rapide, tirée par la demande croissante des utilisateurs finaux en raison de facteurs tels que l'évolution des préférences des consommateurs, les avancées technologiques et une plus grande sensibilisation aux avantages du produit. À mesure que la demande augmente, les entreprises élargissent leurs offres, innovent pour répondre aux besoins des consommateurs et capitalisent sur les tendances émergentes, ce qui alimente davantage la croissance du marché.
La densité des acteurs du marché fait référence à la répartition des entreprises ou des sociétés opérant sur un marché ou un secteur particulier. Elle indique le nombre de concurrents (acteurs du marché) présents sur un marché donné par rapport à sa taille ou à sa valeur marchande totale.
Les principales entreprises opérant sur le marché de l'authentification 3D Secure sont :
- Netcetera
- Gpayment Pvt Ltd.
- GROUPE ASEE
- Asiapay Limitée
- Modérum
- Msignia, Inc.
Avis de non-responsabilité : les sociétés répertoriées ci-dessus ne sont pas classées dans un ordre particulier.
- Obtenez un aperçu des principaux acteurs du marché de l'authentification 3D Secure
Actualités et développements récents du marché de l'authentification 3D Secure
Le marché de l'authentification 3D Secure est évalué en collectant des données qualitatives et quantitatives après des recherches primaires et secondaires, qui incluent d'importantes publications d'entreprise, des données d'association et des bases de données. Quelques-uns des développements du marché de l'authentification 3D Secure sont répertoriés ci-dessous :
- Everlink a annoncé l'obtention de la certification 3D Secure et le lancement de son service d'authentification 3D Secure via le service d'authentification des consommateurs VISA (VCAS) pour les produits de cartes Visa et Mastercard. Alors que le commerce électronique s'accélère dans le monde entier, les entreprises sont tenues de prévenir la fraude et de garantir que les transactions sont approuvées de manière transparente. Actuellement, plus de 79 % de toutes les fraudes se produisent lors de transactions sans carte. L'authentification 3D Secure offre une couche de sécurité supplémentaire aux consommateurs, en offrant une expérience améliorée et plus flexible au titulaire de la carte pour les transactions sans carte sur plusieurs appareils. (Source : Everlink, communiqué de presse, janvier 2022)
- PayU, le premier fournisseur indien de solutions de paiement en ligne, a annoncé le lancement du SDK 3D Secure 2.0, qui offre un paiement natif complet et une expérience client supérieure pour toutes les transactions par carte. Les commerçants PayU peuvent offrir une expérience client optimisée tout en se conformant aux principales mises à niveau du réseau de cartes, notamment Visa et Mastercard, tout en bénéficiant d'une meilleure sécurité et d'une meilleure protection contre la fraude. Le SDK 3DS 2.0 léger de PayU offre une latence réduite et une réduction de 40 % du temps de paiement. PayU a développé cette offre certifiée EMVCo en collaboration avec Wibmo, une société mondiale de PayTech à pile complète détenue par PayU. (Source : Procurato, communiqué de presse, février 2023)
Rapport sur le marché de l'authentification 3D Secure : couverture et livrables
Le rapport « Taille et prévisions du marché de l’authentification sécurisée 3D (2021-2031) » fournit une analyse détaillée du marché couvrant les domaines ci-dessous :
- Taille et prévisions du marché de l'authentification sécurisée 3D aux niveaux mondial, régional et national pour tous les segments de marché clés couverts par le périmètre
- Tendances du marché de l'authentification 3D Secure ainsi que la dynamique du marché telles que les facteurs moteurs, les contraintes et les opportunités clés
- Analyse détaillée des cinq forces de PEST/Porter et SWOT
- Analyse du marché de l'authentification sécurisée 3D couvrant les principales tendances du marché, le cadre mondial et régional, les principaux acteurs, les réglementations et les développements récents du marché
- Analyse du paysage industriel et de la concurrence couvrant la concentration du marché, l'analyse de la carte thermique, les principaux acteurs et les développements récents du marché de l'authentification sécurisée 3D
- Profils d'entreprise détaillés

Ankita est une professionnelle dynamique des études de marché et du conseil, forte de plus de 8 ans d'expérience dans les secteurs des technologies, des médias, des TIC, de l'électronique et des semi-conducteurs. Elle a dirigé et réalisé avec succès plus de 100 missions de conseil et d'études pour des clients internationaux tels que Microsoft, Oracle, NEC Corporation, SAP, KPMG et Expeditors International. Ses compétences clés incluent l'analyse de marché, l'analyse de données, la prévision, la formulation de stratégies, la veille concurrentielle et la rédaction de rapports.
Ankita maîtrise parfaitement la gestion de cycles de projet complets, de la conception de propositions avant-vente et des discussions avec les clients jusqu'à la fourniture d'informations exploitables après-vente. Elle maîtrise la gestion d'équipes transverses, la structuration de modules d'études complexes et l'alignement des solutions sur les objectifs commerciaux spécifiques de chaque client. Ses excellentes compétences en communication, leadership et présentation lui ont permis de fournir systématiquement des résultats à forte valeur ajoutée dans des environnements de marché dynamiques et en constante évolution.
- Analyse complète de la taille du marché et prévisions
- Analyse détaillée de la segmentation
- Évaluation approfondie de la dynamique du marché
- Aperçus par région et par pays
- Paysage concurrentiel et analyse comparative des entreprises
- Intelligence économique stratégique
Témoignages
Le rapport sur le marché des systèmes SCADA d'Insight Partners est complet et fournit des informations précieuses sur les tendances actuelles et les prévisions. L'équipe a fait preuve d'un grand professionnalisme, d'une grande réactivité et d'un grand soutien tout au long du projet. Nous sommes très satisfaits et recommandons vivement leurs services.
RAN KEDEM Partenaire, Reali Technologies LTDJ'ai demandé un rapport sur un marché logiciel très spécifique et l'équipe l'a produit en quelques jours. Les informations étaient très pertinentes et bien présentées. J'ai ensuite demandé des modifications et des ajouts au rapport. L'équipe a de nouveau été très réactive et j'ai reçu le rapport final en moins d'une semaine.
JEAN-HERVÉ JENN Président, Future AnalyticaNous avons collaboré avec The Insight Partners pour une importante étude de marché et des prévisions. Ils nous ont fourni une vision claire des opportunités et des risques, ce qui nous a aidés à élaborer nos plans. Leurs recherches étaient faciles à utiliser et basées sur des données solides. Elles nous ont permis de prendre des décisions éclairées et en toute confiance. Nous les recommandons vivement.
PIYUSH NAGPAL Vice-président principal, Feux de route mondiauxInsight Partners a réalisé une étude de marché pertinente et bien structurée, avec une solide expertise du domaine. Son équipe a fait preuve de professionnalisme et de réactivité tout au long du projet. Son site web convivial a facilité l'accès aux rapports sectoriels. Nous recommandons vivement ses services d'études fiables et de haute qualité.
YUKIHIKO ADACHI PDG, Bleu profond, LLC.C'est la première fois que j'achète une étude de marché auprès de The Insight Partners. J'étais un peu hésitant au début, mais j'ai consulté leur site web et me suis senti plus à l'aise pour prendre le risque d'acheter une étude de marché. Je suis entièrement satisfait de la qualité du rapport et du service client. J'avais plusieurs questions et commentaires concernant le rapport initial, mais après quelques échanges par e-mail avec leur analyste, je pense avoir obtenu un rapport qui pourra alimenter notre processus de planification stratégique. Merci beaucoup pour votre temps et pour avoir rendu cette expérience positive. Je recommanderai sans hésiter vos services et vous serez mon premier contact lorsque nous aurons besoin de données de marché supplémentaires.
JOHN SUZUKI Président-directeur général, administrateur du conseil d'administration, BK TechnologiesJe tiens à vous remercier pour votre soutien et le professionnalisme dont vous avez fait preuve lors du traitement de ma demande d'informations concernant le marché des dispositifs de diagnostic in vitro (DIV) pour les maladies infectieuses au Nigéria. J'apprécie votre patience, vos conseils et votre volonté d'offrir une réduction, ce qui nous a finalement permis de conclure un accord. Je me réjouis de collaborer à nouveau avec The Insight Partners, grâce à l'impression que vous m'avez laissée suite à cette première rencontre.
DR CHIJIOKE DIRECTEUR GÉNÉRAL D'ONYIA, PineCrest Healthcare Ltd.Raison d'acheter
- Prise de décision éclairée
- Compréhension de la dynamique du marché
- Analyse concurrentielle
- Connaissances clients
- Prévisions de marché
- Atténuation des risques
- Planification stratégique
- Justification des investissements
- Identification des marchés émergents
- Amélioration des stratégies marketing
- Amélioration de l'efficacité opérationnelle
- Alignement sur les tendances réglementaires


