
Automated Cell Counters Market Trends and Future Outlook (2026-2034)
Coverage: By Type (Hematocytometers, Flow Cytometers, Electrical Impedance Coulter Counter, and Spectrophotometers) and End User (Hospitals, Research Laboratories, Diagnostic Centers, and Others)
- Status : Data Released
- Report Code : TIPRE00020833
- Category : Life Sciences
- No. of Pages : 150
- Available Report Formats :


- Last update date : December 19, 2025

2025 Market Size
US$ 8.74 Bn
Base year value
2034 Forecast
US$ 14.61 Bn
Projected by 2034
CAGR 2026-2034
5.88 %
Growth rate
Addressable Market
US$ 105.81 Bn
(2026-2034)
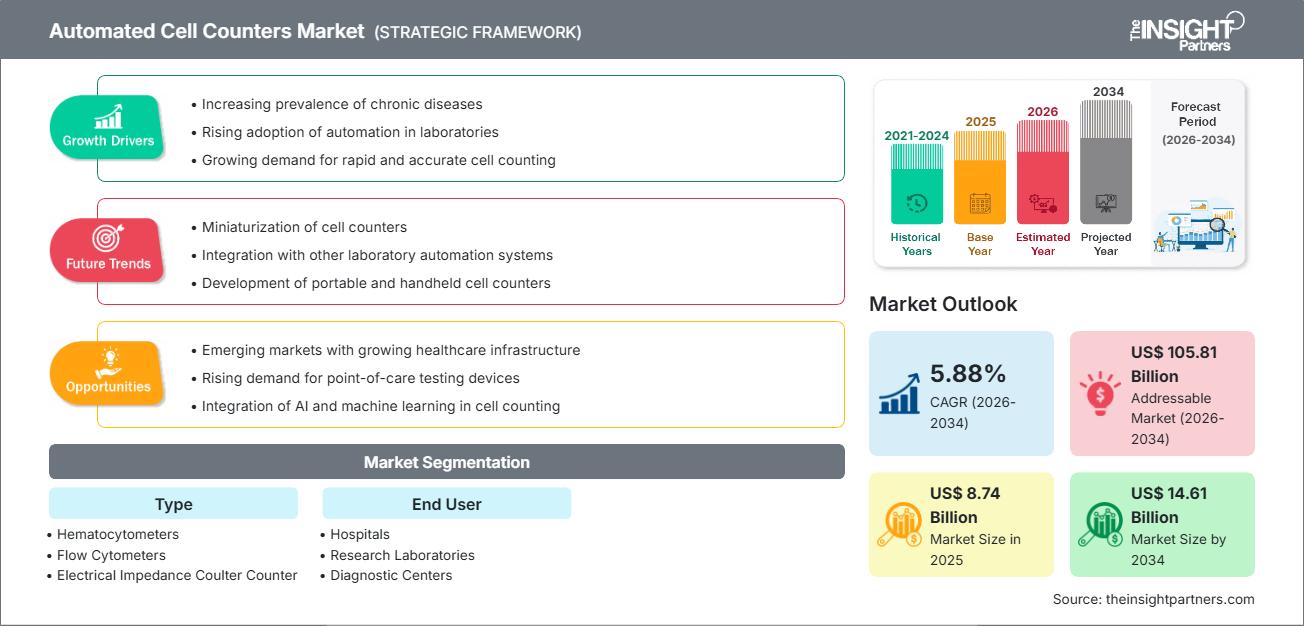
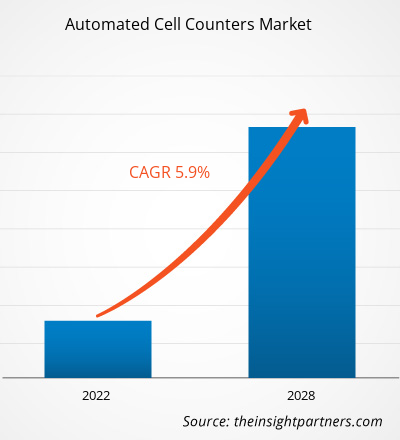
The automated cell counters market size is expected to reach US$14.61 billion by 2034 from US$8.74 billion in 2025. The market is anticipated to register a CAGR of 5.88% during the forecast period of 2026–2034.
Automated Cell Counters Market Analysis
The automated cell counters market forecast indicates robust growth, primarily driven by an increasing demand for high-throughput, accurate cell analysis in clinical diagnostics, academic research, and the growing biopharmaceutical industry. The rising prevalence of chronic diseases across the globe, especially hematological cancers and infectious diseases, is creating greater demand for sophisticated diagnostic tools that can handle large volumes efficiently while maintaining high levels of accuracy. Market expansion is further facilitated by significant technological advancements, including the integration of Artificial Intelligence (AI) and advanced image-based analysis, which minimizes manual variability and enhances the precision of cell viability and morphology assessments. The global shift toward adopting automated solutions to achieve standardization and reduce laboratory turnaround times is the cornerstone of this forecasted market growth.
Automated Cell Counters Market Overview
Automated cell counters (ACC) are sophisticated laboratory instruments designed to accurately quantify and assess the viability of cells in various fluid samples, representing a critical evolution from error-prone traditional manual methods. The systems use various technologies, including impedance, light scattering (flow cytometric), and image recognition, among others, to offer fast, objective, and reproducible results. ACC systems are vital across major healthcare sectors such as hospitals, specialized diagnostic centers, and CROs. Applications cover key areas of CBC in hematology, precise diagnostics of cancer, e.g., leukemia monitoring, and critical quality control during bioprocessing, particularly manufacturing stem cell and cell therapies. ACC solutions form the operational backbone of high-stakes clinical and research environments by facilitating workflow efficiency and data integrity.
Market Assessment and Insights
- Global market for Automated Cell Counters was valued at US$ 8.74 Billion in 2025
- Annual market size is expected to reach US$ 14.61 Billion by 2034
- Total addressable market (TAM) during 2026-2034 is projected to reach approximately US$ 105.81 Billion
- Market is anticipated to register a CAGR of 5.88% during the forecast period
- The United States represents a key market, supported by Increasing prevalence of chronic diseases, Rising adoption of automation in laboratories, Growing demand for rapid and accurate cell counting, as well as evolving industry dynamics
- Market analysis covers North America, Europe, Asia-Pacific, South and Central America, Middle East and Africa, with growth evaluated across the forecast period
- Market opportunities such as Emerging markets with growing healthcare infrastructure, Rising demand for point-of-care testing devices, Integration of AI and machine learning in cell counting are expected to influence market dynamics and addressable market
- Report profiles industry participants, including Eppendorf, Thermo Fisher Scientific Inc., Countstar Inc., Bio-Rad Laboratories, Inc., F. Hoffmann-La Roche Ltd, Chemometec A/S, Aligned Genetics, Beckman Coulter, Inc. (Danaher), Nanoentek, Olympus Corporation, Merck KGaA, Sysmex Corporation, Agilent Technologies, Inc., Abbott Laboratories, Nexcelom Bioscience LLC., while analyzing competitive strategies and innovation developments
-
Source: The Insight Partners' analysis based on proprietary research, government publications, company annual reports, investor presentations, industry databases, and expert interviews.
● REPORT CUSTOMIZATION
Tailor This Report To Align With Your Specific Business Requirements
This report can be customized to align precisely with your business objectives, scope, and target markets. Customization options include tailored segmentation, geography, competitive analysis, and strategic insights to support informed decision-making.
Customize This Report →WHAT YOU CAN ADJUST
- ● Segmentations
- ● Geography
- ● Competitive Analysis
- ● Language Preferences
Automated Cell Counters Market: Strategic Insights
-
Get Top Key Market Trends of this report.This FREE sample will include data analysis, ranging from market trends to estimates and forecasts.
Automated Cell Counters Market Drivers and Opportunities
Market Drivers:
- Rising Demand for High-Throughput Diagnostics and Screening: Global population growth, aging demographics, and the subsequent rise in patient volumes require diagnostic systems capable of processing samples quickly and accurately. Automated counters meet this demand by enabling continuous, high-speed analysis, significantly improving laboratory efficiency and reducing the administrative burden associated with manual counting.
- Advancements in Cell-Based Research and Biopharmaceutical Production: The dramatic increase in research activity related to regenerative medicine, immunotherapy (such as CAR-T cell therapies), and vaccine development necessitates precise cell counting and viability assessment at multiple stages of the manufacturing process. Automated systems are crucial for maintaining the quality and consistency of these high-value biological products.
- Shift Toward Automation in Clinical and Research Laboratories: There is an accelerating trend across healthcare institutions to replace subjective, labor-intensive manual methods with automated technologies. This shift is primarily motivated by the need for standardization, improved result consistency, and the reduction of human error, especially in time-sensitive oncology and hematology testing.
Market Opportunities:
- Integration with AI and Machine Learning for Enhanced Analysis: The future growth trajectory is heavily reliant on incorporating AI and ML algorithms. These enable advanced image-based analysis, automatic differentiation of cell types, and predictive analytics related to cell health and function-all far beyond the capabilities of traditional counting methods.
- Emerging Applications in Personalized Medicine and Liquid Biopsies: Automated counters are playing an increasingly important role in the highly specific monitoring required for personalized treatment regimens and cell therapy delivery. They provide the precise quantitative data needed to track therapeutic response and ensure patient safety.
- Expansion in Emerging Markets with Growing Healthcare Infrastructure: Regions like Asia-Pacific and Latin America are witnessing significant public and private investment in healthcare infrastructure and research facilities. This expansion creates an enormous untapped market for automated, cost-effective cell counting solutions that facilitate the rapid modernization of diagnostic capabilities.
Automated Cell Counters Market Report Segmentation Analysis
The automated cell counters market is comprehensively segmented by the underlying technology (Type) and the primary operational environments (End User) to reflect the diverse applications and usage patterns across the industry. Below is the standard segmentation approach used in most industry reports:
By Type:
- Hematocytometers (Automated)
- Flow Cytometers
- Electrical Impedance Coulter Counter
- Spectrophotometers
By End User:
- Hospitals and Diagnostic Centers
- Research Laboratories
- Biotechnology and Pharmaceutical Companies
By Geography:
- North America
- Europe
- Asia Pacific
- South & Central America
- Middle East & Africa
Automated Cell Counters Market Report Scope
| Report Attribute | Details |
|---|---|
| Market size in 2025 | US$ 8.74 Billion |
| Market Size by 2034 | US$ 14.61 Billion |
| Global CAGR (2026 - 2034) | 5.88% |
| Historical Data | 2021-2024 |
| Forecast period | 2026-2034 |
| Segments Covered |
By Type
|
| Regions and Countries Covered |
North America
|
| Market leaders and key company profiles |
|
Automated Cell Counters Market Players Density: Understanding Its Impact on Business Dynamics
The Automated Cell Counters Market is growing rapidly, driven by increasing end-user demand due to factors such as evolving consumer preferences, technological advancements, and greater awareness of the product's benefits. As demand rises, businesses are expanding their offerings, innovating to meet consumer needs, and capitalizing on emerging trends, which further fuels market growth.
Automated Cell Counters Market Share Analysis by Geography
Asia-Pacific is expected to grow fastest in the coming years. Emerging markets in South & Central America, the Middle East, and Africa also offer significant opportunities for automated cell counter providers to expand.
The automated cell counters market shows a different growth trajectory in each region due to factors such as healthcare infrastructure, regulatory environment, digital health adoption, and government initiatives. Below is a summary of market share and trends by region:
North America
- Market Share: Holds the largest market share due to a highly advanced healthcare infrastructure and strong regulatory support for diagnostic accuracy.
- Key Drivers: High per capita healthcare expenditure
- Trends: Leading integration of AI-powered image analysis and high-throughput flow cytometry systems in clinical pathology labs.
Europe
- Market Share: Significant share driven by strong academic research funding and public health digitization projects.
- Key Drivers: Government mandates supporting advanced diagnostics
- Trends: Focus on interoperability of ACC systems with central Laboratory Information Management Systems (LIMS) and increased use in immunotherapy trials.
Asia Pacific
- Market Share: Fastest-growing region owing to rapid healthcare expansion and increasing life science research investments.
- Key Drivers: Growing medical tourism
- Trends: High adoption of compact, cost-effective automated impedance and image-based counters in newly established diagnostic centers and smaller clinics.
South and Central America
- Market Share: Emerging market with growth potential due to healthcare infrastructure modernization.
- Key Drivers: Rising patient awareness
- Trends: Preference for scalable, durable automated haematology analysers suited to laboratories with varying resources.
Middle East and Africa
- Market Share: Developing market with strong growth potential driven by national healthcare investment strategies.
- Key Drivers: Government-led national e-health strategies
- Trends: Implementation of advanced automated counters as part of integrated health information systems, often via international partnerships.
Competitive Landscape and Key Players Market Density and Competition
The Automated Cell Counters Market is characterized by moderate consolidation, with intense competition among a few global industry leaders who focus on technology differentiation (especially in flow cytometry and image analysis) and expanding their geographic footprint. Key competitive factors include the accuracy of cell viability assessment, the speed of analysis, the size and portability of the devices, and the seamless integration of instruments with laboratory software.
This highly competitive environment prompts vendors to differentiate through:
- Technological Innovation: Developing multi-modal systems that combine impedance and optical detection for superior data quality.
- Software and AI Integration: Enhancing systems with machine learning for automated differential counting and quality control checks.
- Strategic Partnerships: Collaborating with large biopharmaceutical companies and research institutions to secure long-term supply contracts for high-throughput counters.
Major Companies operating in the Automated Cell Counters Market are:
- Thermo Fisher Scientific Inc.
- Beckman Coulter, Inc. (Danaher)
- F. Hoffmann-La Roche Ltd
- Eppendorf AG
- Bio-Rad Laboratories, Inc.
- Chemometec A/S
- Countstar Inc.
- Nanoentek
- Aligned Genetics
Disclaimer: The companies listed above are not ranked in any particular order.
Automated Cell Counters Market News and Recent Developments
- Thermo Fisher Scientific Inc.-Launch of Countess 3 Series
Thermo Fisher introduced AI-powered Countess 3 and Countess 3 FL automated cell counters featuring machine-learning algorithms for improved accuracy in both brightfield and fluorescence detection. These counters support rapid <30-second measurements, reusable slides, and compliance with 21 CFR Part 11 for regulated environments. - Beckman Coulter, Inc. (Danaher) – Cydem VT Automated Clone Screening
Beckman Coulter launched a high-throughput system for CHO cell line development, automating up to 90% of manual steps in clone screening. - F. Hoffmann‑La Roche Ltd – Cedex Analyzer Family
Roche launched new Cedex Bio and Cedex Bio HT analyzers, offering high-throughput cell and metabolite analysis (up to 300 tests/hour) for bioprocess monitoring.
Automated Cell Counters Market Report Coverage and Deliverables
The "Automated Cell Counters Market Size and Forecast (2021–2034)" report provides a detailed analysis of the market covering below areas:
- Automated Cell Counters Market size and forecast at global, regional, and country levels for all the key market segments covered under the scope.
- Automated Cell Counters Market trends, as well as market dynamics such as drivers, restraints, and key opportunities.
- Detailed PEST and SWOT analysis.
- Automated Cell Counters Market analysis covering key market trends, global and regional framework, major players, regulations, and recent market developments.
- Industry landscape and competition analysis covering market concentration, heat map analysis, prominent players, and recent developments in the Automated Cell Counters Market.
- Detailed company profiles.
Frequently Asked Questions

- Comprehensive Market Sizing and Forecast Analysis
- Detailed Segmentation Analysis
- In-Depth Market Dynamics Assessment
- Regional and Country-Level Insights
- Competitive Landscape and Company Benchmarking
- Strategic Business Intelligence
Recent Reports
Testimonials
The Insight Partners' SCADA System Market report is comprehensive, with valuable insights on current trends and future forecasts. The team was highly professional, responsive, and supportive throughout. We are very satisfied and highly recommend their services.
RAN KEDEM Partner, Reali Technologies LTDsI requested a report on a very specific software market and the team produced the report in a few days. The information was very relevant and well presented. I then requested some changes and additions to the report. The team was again very responsive and I got the final report in less than a week.
JEAN-HERVE JENN Chairman, Future AnalyticaWe worked with The Insight Partners for an important market study and forecast. They gave us clear insights into opportunities and risks, which helped shape our plans. Their research was easy to use and based on solid data. It helped us make smart, confident decisions. We highly recommend them.
PIYUSH NAGPAL Sr. Vice President, High Beam GlobalThe Insight Partners delivered insightful, well-structured market research with strong domain expertise. Their team was professional and responsive throughout. The user-friendly website made accessing industry reports seamless. We highly recommend them for reliable, high-quality research services
YUKIHIKO ADACHI CEO, Deep Blue, LLC.This is the first time I have purchased a market report from The Insight Partners.While I was unsure at first, I visited their web site and felt more comfortable to take the risk and purchase a market report.I am completely satisfied with the quality of the report and customer service. I had several questions and comments with the initial report, but after a couple of dialogs over email with their analyst I believe I have a report that I can use as input to our strategic planning process.Thank you so much for taking the extra time and making this a positive experience.I will definitely recommend your service to others and you will be my first call when we need further market data.
JOHN SUZUKI President and Chief Executive Officer, Board Director, BK TechnologiesI wish to appreciate your support and the professionalism you displayed in the course of attending to my request for information regarding to infectious disease IVD market in Nigeria. I appreciate your patience, your guidance, and the fact that you were willing to offer a discount, which eventually made it possible for us to close a deal. I look forward to engaging The Insight Partners in the future, all thanks to the impression you have created in me as a result of this first encounter.
DR CHIJIOKE ONYIA MANAGING DIRECTOR, PineCrest Healthcare Ltd.Reason to Buy
- Informed Decision-Making
- Understanding Market Dynamics
- Competitive Analysis
- Identifying Emerging Markets
- Customer Insights
- Market Forecasts
- Risk Mitigation
- Boosting Operational Efficiency
- Strategic Planning
- Investment Justification
- Tracking Industry Innovations
- Aligning with Regulatory Trends


