US Non-Emergency Medical Transportation Market Growth Opportunities and Forecast by 2031
US Non-Emergency Medical Transportation Market Size and Forecast (2021 - 2031), Country Share, Trend, and Growth Opportunity Analysis Report Coverage: By Service Type (Private Pay Patient Transportation, Insurance Backed Patient Transportation, Courier Services, and Others), Facility (Intra-Facility and Inter-Facility), Application (Dialysis, Routine Doctor Visits, Mental Health Related Appointments, Rehabilitation, and Others), End User (Hospitals and Clinics, Nursing Homes, Homecare Settings, MCO and State Agencies, Healthcare Payers, and Others), and Country
- Status : Published
- Report Code : TIPRE00029536
- Category : Life Sciences
- No. of Pages : 125
- Available Report Formats :


The US non-emergency medical transportation market size is projected to reach US$ 13,438.87 million by 2031 from US$ 6,588.07 million in 2023. The market is expected to register a CAGR of 9.3% during 2023–2031. The expanding role of technology in NEMT is likely to bring new trends in the market in the coming years.
US Non-Emergency Medical Transportation Market Analysis
Non-emergency medical transportation (NEMT) covers transport services that bring patients to and from healthcare destinations between sessions without any need for emergency medical intervention during transit. This service is intended for patients with limited mobility due to ill health or those living in areas without available transportation to access necessary health facilities. Most transportation services included under this NEMT umbrella tend to be routine doctor visits, physical therapy sessions, some minor surgeries, or appointments for dialysis treatments, as well as any other medically related events. The major factors driving the market are the increasing demand for non-emergency medical transportation, the rising aging population, and the increasing incidence of chronic conditions. Additionally, strategic initiatives by NEMT and transportation network companies are expected to create ample opportunities in the coming years.
US Non-Emergency Medical Transportation Market Overview
The District of Columbia, Alabama, Arkansas, Delaware, Louisiana, Maryland, Florida, Georgia, Kentucky, South Carolina, Tennessee, Mississippi, North Carolina, Oklahoma, Texas, Virginia, and West Virginia are the states covered under South US by the US federal government.
According to the Data from the 2021 American Community Survey (ACS), over 3.5 million Texans aged 65 and older had at least one disability, and about half (49%) of all Texans aged 75 and older had a disability.. With the growing cases of disability, the demand for NEMT for the disabled population is increasing, favoring market growth.
Market players in the US are implementing inorganic growth strategies, such as partnerships and collaborations, for market expansion and growth. In June 2022, AdventHealth Gordon & AdventHealth Murray collaborated with Amtran Medical Transport to provide transportation services to patients requiring medical care in non-emergency conditions. In addition, Uber Health expanded NEMT to Texas Medicaid recipients in August 2021. Texas' nearly 4.4 million Medicaid enrollees have access to NEMT services through Uber Health.
Customize Research To Suit Your Requirement
We can optimize and tailor the analysis and scope which is unmet through our standard offerings. This flexibility will help you gain the exact information needed for your business planning and decision making.
US Non-Emergency Medical Transportation Market: Strategic Insights
Market Size Value in US$ 5,653.6 million in 2021 Market Size Value by US$ 10,246.7 million by 2028 Growth rate CAGR of 9.1% from 2022 to 2028 Forecast Period 2022-2028 Base Year 2021

Mrinal
Have a question?
Mrinal will walk you through a 15-minute call to present the report’s content and answer all queries if you have any.
 Speak to Analyst
Customize Research To Suit Your Requirement
We can optimize and tailor the analysis and scope which is unmet through our standard offerings. This flexibility will help you gain the exact information needed for your business planning and decision making.
US Non-Emergency Medical Transportation Market: Strategic Insights
| Market Size Value in | US$ 5,653.6 million in 2021 |
| Market Size Value by | US$ 10,246.7 million by 2028 |
| Growth rate | CAGR of 9.1% from 2022 to 2028 |
| Forecast Period | 2022-2028 |
| Base Year | 2021 |
Mrinal
Have a question?
Mrinal will walk you through a 15-minute call to present the report’s content and answer all queries if you have any.
Speak to Analyst
US Non-Emergency Medical Transportation Market Drivers and Opportunities
Increasing Demand for Non-Emergency Medical Transportation
According to the American Hospital Association, each year, ~3.6 million individuals in the US do not obtain medical care due to transportation issues (lack of vehicle access, long distances to healthcare facilities, inadequate public transportation infrastructure, and the cost of transportation). A study by UC Davis Health revealed that ~5.8 million Americans experience missed or delayed medical care each year due to transportation barriers. Transportation is a significant factor contributing to missed medical appointments. A 2019 survey by Kaiser Permanente found that one-third of Americans frequently or occasionally undergo stress due to transportation.
Since 1965, Medicaid has had a non-emergency medical transportation (NEMT) benefit, and people covered by Medicaid are provided with transportation services as an essential benefit. As per Medicaid Enrollment and Unwinding Tracker, ~94 million individuals in total were enrolled in Medicaid till April 2023. The KFF Medicaid Budget Survey anticipated an 8.2% increase in healthcare membership in 2021 in the US, primarily driven by the COVID-19 crisis and elevated unemployment rate. As more people gain access to Medicaid, there is a direct increase in demand for NEMT services. The need and demand for NEMT services increase with the increase in healthcare enrollment and eligibility.
Most of the states in the US have transitioned to deliver NEMT through NEMT brokers or managed care organizations (MCOs). In many states, the brokers or MCOs receive a per capita payment to oversee the NEMT services, while other states, including Nevada, Arizona, and Vermont, deliver NEMT on a fee-for-service basis through local service providers. The Children's Health Insurance Program (CHIP) offers health coverage to eligible children via Medicaid and separate CHIP programs. CHIP is administered by states in accordance with federal requirements and jointly funded by state and federal governments. Therefore, with an increase in such initiatives by governments, the demand for NEMT is increasing in the US, thereby driving market growth.
Strategic Initiatives by NEMT and Transportation Network Companies
NEMT companies and transportation network companies (TNCs) are eager to undertake strategic actions to improve access to care. TNCs, such as Uber and Lyft, are known for their on-demand ride-hailing capabilities and user-friendly mobile apps. These features can effectively address the availability and scheduling issues related to NEMT services. Various TNCs are currently developing new platforms or are engaged in collaborations with NEMT and individual healthcare service providers across the US. Several state agencies are allowing the use of TNCs to provide NEMT services. A few examples are given below.
- In June 2024, Uber officially introduced Uber Health, a platform aimed at helping patients reach their medical appointments, which could reduce no-shows and enhance punctuality. This initiative is HIPAA-compliant and offers a cost-effective alternative to traditional taxi services, particularly benefiting smaller healthcare organizations lacking dedicated transportation resources. With coverage in over 250 US cities, Uber's healthcare-focused platform significantly broadens access to NEMT.
- In January 2024, MediDrive, a CTG partner company, formally entered the NEMT market. The company is dedicated to addressing the complexities of transporting patients to and from their healthcare appointments and procedures.
- In June 2022, MTM launched the Elevate program to provide proactive trip management. MTM takes a proactive approach to managing trips for members in its Elevate Program, providing concierge-level service for complex journeys and addressing the unique transportation needs of its members.
- In February 2022, Modivcare Inc. launched Modivcare Academy. This innovative initiative aims to assist transportation providers in NEMT by delivering educational resources, networking opportunities, and training. The program uniquely equips transportation providers with essential business tools, best practices, and training to effectively support the care of the nation's most vulnerable populations.
Such strategic initiatives focus on enhancing service efficiency, increasing patient accessibility, reducing operational costs, and ensuring better integration with healthcare services. As the NEMT sector continues to grow, these initiatives will be crucial in expanding services and improving the quality of patient care across the US.
US Non-Emergency Medical Transportation Market Report Segmentation Analysis
Key segments that contributed to the derivation of the US non-emergency medical transportation market analysis are service type, facility, application, and end user.
- In terms of service type, the US non-emergency medical transportation market is segmented into private pay patient transportation, insurance backed patient transportation, courier services, and others. The private pay patient transportation segment held the largest share of the market in 2023.
- Based on facility, the market is bifurcated into intra-facility and inter-facility. The inter-facility segment dominated the market in 2023.
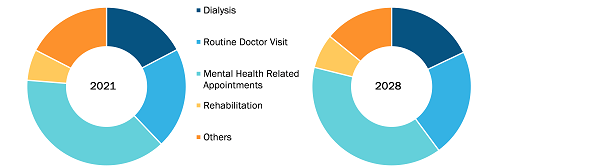
- Based on application, the market is segmented into dialysis, routine doctor visits, mental health related appointments, rehabilitation, and others. The mental health related appointments segment held the largest share of the market in 2023.
- By end user, the market is categorized into hospitals and clinics, nursing homes, homecare settings, MCO and state agencies, healthcare payers, and others. The hospitals and clinics segment dominated the market in 2023.
US Non-Emergency Medical Transportation Market Share Analysis by Country
The US non-emergency medical transportation market is a dynamic and rapidly evolving sector, primarily driven by the increasing prevalence of various diseases, expanding insurance coverage for non-emergency medical transportation (NEMT), and high state-wise reimbursement rates for these services as administrative or medical expenses. In addition, a shift toward patient-centered care, heightened awareness of NEMT, and technological advancements are a few factors supporting the market growth. Chronic illnesses, old age, disabilities, injuries, and obesity are just a few of the many reasons Americans rely on non-emergency medical transportation services. Also, the COVID-19 pandemic generated an enormous need for reliable car transportation for appointments, essential doctor visits, and daily treatments. In addition, the increase in the number of senior citizens is contributing to the growth of the non-emergency medical transportation market in the country.
US Non-Emergency Medical Transportation Market Report Scope
US Non-Emergency Medical Transportation Market News and Recent Developments
The US non-emergency medical transportation market is evaluated by gathering qualitative and quantitative data post primary and secondary research, which includes important corporate publications, association data, and databases. A few of the developments in the US non-emergency medical transportation market are listed below:
- MTM, the nation's largest privately held non-emergency medical transportation (NEMT) broker, signed an agreement with Global Medical Response to acquire Access2Care, LLC. This strategic acquisition significantly enhanced MTM's market presence and increased total annual revenue, marking a milestone in the company's growth trajectory. The acquisition of Access2Care's NEMT business comes after careful consideration and aligns with MTM's strategic expansion initiatives. (Source: MTM, Company Website, August 2024)
- Transdev and First Transit are part of the same company and operate under the Transdev brand. This transaction made Transdev the leading operator of safe, cost-effective, and environmentally friendly public transportation services in the US and Canada. The combined company provides a wide range of transit solutions, including fixed-route bus systems, paratransit, shuttle services, rail, light rail, and fleet maintenance. (Source: Transdev, Press Release, March 2023)
US Non-Emergency Medical Transportation Market Report Coverage and Deliverables
The "US Non-Emergency Medical Transportation Market Size and Forecast (2021–2031)" report provides a detailed analysis of the market covering below areas:
- US non-emergency medical transportation market size and forecast at country levels for all the key market segments covered under the scope
- US non-emergency medical transportation market trends as well as market dynamics such as drivers, restraints, and key opportunities
- Detailed PEST and SWOT analysis
- US non-emergency medical transportation market analysis covering key market trends, country framework, major players, regulations, and recent market developments
- Industry landscape and competition analysis covering market concentration, heat map analysis, prominent players, and recent developments for the US non-emergency medical transportation market
- Detailed company profiles

Report Coverage
Revenue forecast, Company Analysis, Industry landscape, Growth factors, and Trends

Segment Covered
Service Type, and Application, and End user

Regional Scope
North America, Europe, Asia Pacific, Middle East & Africa, South & Central America

Country Scope
Midwest, Northeast, South Korea, West
Frequently Asked Questions
The market segmentation by service type is led by private pay patient transportation segment that is growing significantly due to custom NEMT rate of reimbursements with higher margins compared to other, low-cost, and flexibility pay and less complicated billing process compared to Medicare and Medicaid services.
The market is estimated to grow with a CAGR of 9.3% from 2023 to 2031.
Key factors that are driving growth of the market are increasing demand for non-emergency medical transportation and aging population and increasing incidence of chronic conditions fuel the growth of the market.
Non-Emergency Medical Transportation (NEMT) covers transportation services offered to the patients who are not in an emergency or in need assistance getting to and from medical appointments avoiding travel which are costly. These services are most widely used by the eligible Medicaid and Medicare members.
1. Introduction
1.1 The Insight Partners Research Report Guidance
1.2 Market Segmentation
2. Executive Summary
2.1 Key Insights
3. Research Methodology
3.1 Secondary Research
3.2 Primary Research
3.2.1 Hypothesis formulation:
3.2.2 Macro-economic factor analysis:
3.2.3 Developing base number:
3.2.4 Data Triangulation:
3.2.5 Country level data:
4. US Non-Emergency Medical Transportation Market Landscape
4.1 Overview
4.2 PEST Analysis
4.3 Medicaid MCO Health Plans and Advantages
4.4 Medicare MCO Health Plans and Advantages
5. US Non-Emergency Medical Transportation Market – Key Market Dynamics
5.1 US Non-Emergency Medical Transportation Market – Key Market Dynamics
5.2 Market Drivers
5.2.1 Increasing Demand for Non-Emergency Medical Transportation
5.2.2 Aging Population and Increasing Incidence of Chronic Conditions
5.3 Market Restraints
5.3.1 Lack of Efficient Oversight Systems and Fraud by Non-Emergency Medical Transportation Companies
5.4 Market Opportunities
5.4.1 Strategic Initiatives by NEMT and Transportation Network Companies
5.5 Future Trends
5.5.1 Expanding Role of Technology in NEMT
5.6 Impact of Drivers and Restraints:
6. US Non-Emergency Medical Transportation Market Analysis
6.1 US Non-Emergency Medical Transportation Market Revenue (US$ Million), 2021–2031
6.2 US Non-Emergency Medical Transportation Market Forecast and Analysis
7. US Non-Emergency Medical Transportation Market Analysis – by Service Type
7.1 Private Pay Patient Transportation
7.1.1 Overview
7.1.2 Private Pay Patient Transportation: US Non-Emergency Medical Transportation Market – Revenue and Forecast to 2031 (US$ Million)
7.2 Insurance Backed Patient Transportation
7.2.1 Overview
7.2.2 Insurance Backed Patient Transportation: US Non-Emergency Medical Transportation Market – Revenue and Forecast to 2031 (US$ Million)
7.3 Courier Services
7.3.1 Overview
7.3.2 Courier Services: US Non-Emergency Medical Transportation Market – Revenue and Forecast to 2031 (US$ Million)
7.4 Others
7.4.1 Overview
7.4.2 Others: US Non-Emergency Medical Transportation Market – Revenue and Forecast to 2031 (US$ Million)
8. US Non-Emergency Medical Transportation Market Analysis – by Facility
8.1 Intra-Facility
8.1.1 Overview
8.1.2 Intra-Facility: US Non-Emergency Medical Transportation Market – Revenue and Forecast to 2031 (US$ Million)
8.2 Inter-Facility
8.2.1 Overview
8.2.2 Inter-Facility: US Non-Emergency Medical Transportation Market – Revenue and Forecast to 2031 (US$ Million)
9. US Non-Emergency Medical Transportation Market Analysis – by Application
9.1 Dialysis
9.1.1 Overview
9.1.2 Dialysis: US Non-Emergency Medical Transportation Market – Revenue and Forecast to 2031 (US$ Million)
9.2 Routine Doctor Visits
9.2.1 Overview
9.2.2 Routine Doctor Visits: US Non-Emergency Medical Transportation Market – Revenue and Forecast to 2031 (US$ Million)
9.3 Mental Health Related Appointments
9.3.1 Overview
9.3.2 Mental Health Related Appointments: US Non-Emergency Medical Transportation Market – Revenue and Forecast to 2031 (US$ Million)
9.4 Rehabilitation
9.4.1 Overview
9.4.2 Rehabilitation: US Non-Emergency Medical Transportation Market – Revenue and Forecast to 2031 (US$ Million)
9.5 Others
9.5.1 Overview
9.5.2 Others: US Non-Emergency Medical Transportation Market – Revenue and Forecast to 2031 (US$ Million)
10. US Non-Emergency Medical Transportation Market Analysis – by End User
10.1 Hospitals and Clinics
10.1.1 Overview
10.1.2 Hospitals and Clinics: US Non-Emergency Medical Transportation Market – Revenue and Forecast to 2031 (US$ Million)
10.2 Nursing Homes
10.2.1 Overview
10.2.2 Nursing Homes: US Non-Emergency Medical Transportation Market – Revenue and Forecast to 2031 (US$ Million)
10.3 Homecare Settings
10.3.1 Overview
10.3.2 Homecare Settings: US Non-Emergency Medical Transportation Market – Revenue and Forecast to 2031 (US$ Million)
10.4 MCO and State Agencies
10.4.1 Overview
10.4.2 MCO and State Agencies: US Non-Emergency Medical Transportation Market – Revenue and Forecast to 2031 (US$ Million)
10.5 Healthcare Payers
10.5.1 Overview
10.5.2 Healthcare Payers: US Non-Emergency Medical Transportation Market – Revenue and Forecast to 2031 (US$ Million)
10.6 Others
10.6.1 Overview
10.6.2 Others: US Non-Emergency Medical Transportation Market – Revenue and Forecast to 2031 (US$ Million)
11. US Non-Emergency Medical Transportation Market – Country Analysis
11.1 US
11.1.1 US Non-Emergency Medical Transportation Market Breakdown by Countries
11.1.2 US Non-Emergency Medical Transportation Market Revenue and Forecast and Analysis – by Country
11.1.2.1 US Non-Emergency Medical Transportation Market Revenue and Forecast and Analysis – by Country
11.1.2.2 Northeast: US Non-Emergency Medical Transportation Market – Revenue and Forecast to 2031 (US$ Million)
11.1.2.2.1 Northeast: US Non-Emergency Medical Transportation Market Breakdown by Service Type
11.1.2.2.2 Northeast: US Non-Emergency Medical Transportation Market Breakdown by Facility
11.1.2.2.3 Northeast: US Non-Emergency Medical Transportation Market Breakdown by Application
11.1.2.2.4 Northeast: US Non-Emergency Medical Transportation Market Breakdown by End User
11.1.2.3 Midwest: US Non-Emergency Medical Transportation Market – Revenue and Forecast to 2031 (US$ Million)
11.1.2.3.1 Midwest: US Non-Emergency Medical Transportation Market Breakdown by Service Type
11.1.2.3.2 Midwest: US Non-Emergency Medical Transportation Market Breakdown by Facility
11.1.2.3.3 Midwest: US Non-Emergency Medical Transportation Market Breakdown by Application
11.1.2.3.4 Midwest: US Non-Emergency Medical Transportation Market Breakdown by End User
11.1.2.4 South: US Non-Emergency Medical Transportation Market – Revenue and Forecast to 2031 (US$ Million)
11.1.2.4.1 South: US Non-Emergency Medical Transportation Market Breakdown by Service Type
11.1.2.4.2 South: US Non-Emergency Medical Transportation Market Breakdown by Facility
11.1.2.4.3 South: US Non-Emergency Medical Transportation Market Breakdown by Application
11.1.2.4.4 South: US Non-Emergency Medical Transportation Market Breakdown by End User
11.1.2.5 West: US Non-Emergency Medical Transportation Market – Revenue and Forecast to 2031 (US$ Million)
11.1.2.5.1 West: US Non-Emergency Medical Transportation Market Breakdown by Service Type
11.1.2.5.2 West: US Non-Emergency Medical Transportation Market Breakdown by Facility
11.1.2.5.3 West: US Non-Emergency Medical Transportation Market Breakdown by Application
11.1.2.5.4 West: US Non-Emergency Medical Transportation Market Breakdown by End User
12. US Non-Emergency Medical Transportation Market – Industry Landscape
12.1 Overview
12.2 Growth Strategies in the US Non-Emergency Medical Transportation Market
12.3 Organic Growth Strategies
12.3.1 Overview
12.4 Inorganic Growth Strategies
12.4.1 Overview
13. Company Profiles
13.1 MTM, Inc.
13.1.1 Key Facts
13.1.2 Business Description
13.1.3 Products and Services
13.1.4 Financial Overview
13.1.5 SWOT Analysis
13.1.6 Key Developments
13.2 AMR
13.2.1 Key Facts
13.2.2 Business Description
13.2.3 Products and Services
13.2.4 Financial Overview
13.2.5 SWOT Analysis
13.2.6 Key Developments
13.3 Xpress Transportation
13.3.1 Key Facts
13.3.2 Business Description
13.3.3 Products and Services
13.3.4 Financial Overview
13.3.5 SWOT Analysis
13.3.6 Key Developments
13.4 CJ Medical Transportation
13.4.1 Key Facts
13.4.2 Business Description
13.4.3 Products and Services
13.4.4 Financial Overview
13.4.5 SWOT Analysis
13.4.6 Key Developments
13.5 VERIDA
13.5.1 Key Facts
13.5.2 Business Description
13.5.3 Products and Services
13.5.4 Financial Overview
13.5.5 SWOT Analysis
13.5.6 Key Developments
13.6 ModivCare
13.6.1 Key Facts
13.6.2 Business Description
13.6.3 Products and Services
13.6.4 Financial Overview
13.6.5 SWOT Analysis
13.6.6 Key Developments
13.7 Crothall Healthcare
13.7.1 Key Facts
13.7.2 Business Description
13.7.3 Products and Services
13.7.4 Financial Overview
13.7.5 SWOT Analysis
13.7.6 Key Developments
13.8 Elite Medical Transport
13.8.1 Key Facts
13.8.2 Business Description
13.8.3 Products and Services
13.8.4 Financial Overview
13.8.5 SWOT Analysis
13.8.6 Key Developments
13.9 Acadian Ambulance Service
13.9.1 Key Facts
13.9.2 Business Description
13.9.3 Products and Services
13.9.4 Financial Overview
13.9.5 SWOT Analysis
13.9.6 Key Developments
13.10 Transdev
13.10.1 Key Facts
13.10.2 Business Description
13.10.3 Products and Services
13.10.4 Financial Overview
13.10.5 SWOT Analysis
13.10.6 Key Developments
13.11 Ride Health
13.11.1 Key Facts
13.11.2 Business Description
13.11.3 Products and Services
13.11.4 Financial Overview
13.11.5 SWOT Analysis
13.11.6 Key Developments
13.12 Roundtrip
13.12.1 Key Facts
13.12.2 Business Description
13.12.3 Products and Services
13.12.4 Financial Overview
13.12.5 SWOT Analysis
13.12.6 Key Developments
13.13 Medical Answering Services, LLC
13.13.1 Key Facts
13.13.2 Business Description
13.13.3 Products and Services
13.13.4 Financial Overview
13.13.5 SWOT Analysis
13.13.6 Key Developments
13.14 One Call
13.14.1 Key Facts
13.14.2 Business Description
13.14.3 Products and Services
13.14.4 Financial Overview
13.14.5 SWOT Analysis
13.14.6 Key Developments
13.15 Stellar Transport
13.15.1 Key Facts
13.15.2 Business Description
13.15.3 Products and Services
13.15.4 Financial Overview
13.15.5 SWOT Analysis
13.15.6 Key Developments
13.16 Abba Medical Transportation, LLC
13.16.1 Key Facts
13.16.2 Business Description
13.16.3 Products and Services
13.16.4 Financial Overview
13.16.5 SWOT Analysis
13.16.6 Key Developments
13.17 Able Medical Transportation, Inc.
13.17.1 Key Facts
13.17.2 Business Description
13.17.3 Products and Services
13.17.4 Financial Overview
13.17.5 SWOT Analysis
13.17.6 Key Developments
13.18 Life Ride
13.18.1 Key Facts
13.18.2 Business Description
13.18.3 Products and Services
13.18.4 Financial Overview
13.18.5 SWOT Analysis
13.18.6 Key Developments
13.19 Mobility Transportation Services, Inc.
13.19.1 Key Facts
13.19.2 Business Description
13.19.3 Products and Services
13.19.4 Financial Overview
13.19.5 SWOT Analysis
13.19.6 Key Developments
13.20 ABC Non-Emergency Medical Transportation, LLC
13.20.1 Key Facts
13.20.2 Business Description
13.20.3 Products and Services
13.20.4 Financial Overview
13.20.5 SWOT Analysis
13.20.6 Key Developments
14. Appendix
14.1 About The Insight Partners
14.2 Glossary of Terms
List of Tables
Table 1. US Non-Emergency Medical Transportation Market Segmentation
Table 2. US Non-Emergency Medical Transportation Market – Revenue and Forecast to 2031 (US$ Million)
Table 3. US Non-Emergency Medical Transportation Market – Revenue and Forecast to 2031 (US$ Million) – by Service Type
Table 4. US Non-Emergency Medical Transportation Market – Revenue and Forecast to 2031 (US$ Million) – by Facility
Table 5. US Non-Emergency Medical Transportation Market – Revenue and Forecast to 2031 (US$ Million) – by Application
Table 6. US Non-Emergency Medical Transportation Market – Revenue and Forecast to 2031 (US$ Million) – by End User
Table 7. US Non-Emergency Medical Transportation Market – Revenue and Forecast to 2031 (US$ Million) – by Country
Table 8. Northeast: US Non-Emergency Medical Transportation Market – Revenue and Forecast to 2031 (US$ Million) – by Service Type
Table 9. Northeast: US Non-Emergency Medical Transportation Market – Revenue and Forecast to 2031 (US$ Million) – by Facility
Table 10. Northeast: US Non-Emergency Medical Transportation Market – Revenue and Forecast to 2031 (US$ Million) – by Application
Table 11. Northeast: US Non-Emergency Medical Transportation Market – Revenue and Forecast to 2031 (US$ Million) – by End User
Table 12. Midwest: US Non-Emergency Medical Transportation Market – Revenue and Forecast to 2031 (US$ Million) – by Service Type
Table 13. Midwest: US Non-Emergency Medical Transportation Market – Revenue and Forecast to 2031 (US$ Million) – by Facility
Table 14. Midwest: US Non-Emergency Medical Transportation Market – Revenue and Forecast to 2031 (US$ Million) – by Application
Table 15. Midwest: US Non-Emergency Medical Transportation Market – Revenue and Forecast to 2031 (US$ Million) – by End User
Table 16. South: US Non-Emergency Medical Transportation Market – Revenue and Forecast to 2031 (US$ Million) – by Service Type
Table 17. South: US Non-Emergency Medical Transportation Market – Revenue and Forecast to 2031 (US$ Million) – by Facility
Table 18. South: US Non-Emergency Medical Transportation Market – Revenue and Forecast to 2031 (US$ Million) – by Application
Table 19. South: US Non-Emergency Medical Transportation Market – Revenue and Forecast to 2031 (US$ Million) – by End User
Table 20. West: US Non-Emergency Medical Transportation Market – Revenue and Forecast to 2031 (US$ Million) – by Service Type
Table 21. West: US Non-Emergency Medical Transportation Market – Revenue and Forecast to 2031 (US$ Million) – by Facility
Table 22. West: US Non-Emergency Medical Transportation Market – Revenue and Forecast to 2031 (US$ Million) – by Application
Table 23. West: US Non-Emergency Medical Transportation Market – Revenue and Forecast to 2031 (US$ Million) – by End User
Table 24. Recent Organic Growth Strategies in the US Non-Emergency Medical Transportation Market
Table 25. Recent Inorganic Growth Strategies in the US Non-Emergency Medical Transportation Market
Table 26. Glossary of Terms, US Non-Emergency Medical Transportation Market
List of Figures
Figure 1. US Non-Emergency Medical Transportation Market Segmentation, by Country
Figure 2. PEST Analysis
Figure 3. Impact Analysis of Drivers and Restraints
Figure 4. US Non-Emergency Medical Transportation Market Revenue (US$ Million), 2021–2031
Figure 5. US Non-Emergency Medical Transportation Market Share (%) – by Service Type, 2023 and 2031
Figure 6. Private Pay Patient Transportation: US Non-Emergency Medical Transportation Market – Revenue and Forecast to 2031 (US$ Million)
Figure 7. Insurance Backed Patient Transportation: US Non-Emergency Medical Transportation Market – Revenue and Forecast to 2031 (US$ Million)
Figure 8. Courier Services: US Non-Emergency Medical Transportation Market – Revenue and Forecast to 2031 (US$ Million)
Figure 9. Others: US Non-Emergency Medical Transportation Market – Revenue and Forecast to 2031 (US$ Million)
Figure 10. US Non-Emergency Medical Transportation Market Share (%) – by Facility, 2023 and 2031
Figure 11. Intra-Facility: US Non-Emergency Medical Transportation Market – Revenue and Forecast to 2031 (US$ Million)
Figure 12. Inter-Facility: US Non-Emergency Medical Transportation Market – Revenue and Forecast to 2031 (US$ Million)
Figure 13. US Non-Emergency Medical Transportation Market Share (%) – by Application, 2023 and 2031
Figure 14. Dialysis: US Non-Emergency Medical Transportation Market – Revenue and Forecast to 2031 (US$ Million)
Figure 15. Routine Doctor Visits: US Non-Emergency Medical Transportation Market – Revenue and Forecast to 2031 (US$ Million)
Figure 16. Mental Health Related Appointments: US Non-Emergency Medical Transportation Market – Revenue and Forecast to 2031 (US$ Million)
Figure 17. Rehabilitation: US Non-Emergency Medical Transportation Market – Revenue and Forecast to 2031 (US$ Million)
Figure 18. Others: US Non-Emergency Medical Transportation Market – Revenue and Forecast to 2031 (US$ Million)
Figure 19. US Non-Emergency Medical Transportation Market Share (%) – by End User, 2023 and 2031
Figure 20. Hospitals and Clinics: US Non-Emergency Medical Transportation Market – Revenue and Forecast to 2031 (US$ Million)
Figure 21. Nursing Homes: US Non-Emergency Medical Transportation Market – Revenue and Forecast to 2031 (US$ Million)
Figure 22. Homecare Settings: US Non-Emergency Medical Transportation Market – Revenue and Forecast to 2031 (US$ Million)
Figure 23. MCO and State Agencies: US Non-Emergency Medical Transportation Market – Revenue and Forecast to 2031 (US$ Million)
Figure 24. Healthcare Payers: US Non-Emergency Medical Transportation Market – Revenue and Forecast to 2031 (US$ Million)
Figure 25. Others: US Non-Emergency Medical Transportation Market – Revenue and Forecast to 2031 (US$ Million)
Figure 26. US Non-Emergency Medical Transportation Market Breakdown by Key Countries, 2023 and 2031 (%)
Figure 27. Northeast: US Non-Emergency Medical Transportation Market – Revenue and Forecast to 2031 (US$ Million)
Figure 28. Midwest: US Non-Emergency Medical Transportation Market – Revenue and Forecast to 2031 (US$ Million)
Figure 29. South: US Non-Emergency Medical Transportation Market – Revenue and Forecast to 2031 (US$ Million)
Figure 30. West: US Non-Emergency Medical Transportation Market – Revenue and Forecast to 2031 (US$ Million)
Figure 31. Growth Strategies in the US Non-Emergency Medical Transportation Market
Yes! We provide a free sample of the report, which includes Report Scope (Table of Contents), report structure, and selected insights to help you assess the value of the full report. Please click on the "Download Sample" button or contact us to receive your copy.
Absolutely - analyst assistance is part of the package. You can connect with our analyst post-purchase to clarify report insights, methodology or discuss how the findings apply to your business needs.
Once your order is successfully placed, you will receive a confirmation email along with your invoice.
• For published reports: You'll receive access to the report within 4-6 working hours via a secured email sent to your email.
• For upcoming reports: Your order will be recorded as a pre-booking. Our team will share the estimated release date and keep you informed of any updates. As soon as the report is published, it will be delivered to your registered email.
We offer customization options to align the report with your specific objectives. Whether you need deeper insights into a particular region, industry segment, competitor analysis, or data cut, our research team can tailor the report accordingly. Please share your requirements with us, and we'll be happy to provide a customized proposal or scope.
The report is available in either PDF format or as an Excel dataset, depending on the license you choose.
The PDF version provides the full analysis and visuals in a ready-to-read format. The Excel dataset includes all underlying data tables for easy manipulation and further analysis.
Please review the license options at checkout or contact us to confirm which formats are included with your purchase.
Our payment process is fully secure and PCI-DSS compliant.
We use trusted and encrypted payment gateways to ensure that all transactions are protected with industry-standard SSL encryption. Your payment details are never stored on our servers and are handled securely by certified third-party processors.
You can make your purchase with confidence, knowing your personal and financial information is safe with us.
Yes, we do offer special pricing for bulk purchases.
If you're interested in purchasing multiple reports, we're happy to provide a customized bundle offer or volume-based discount tailored to your needs. Please contact our sales team with the list of reports you're considering, and we'll share a personalized quote.
Yes, absolutely.
Our team is available to help you make an informed decision. Whether you have questions about the report's scope, methodology, customization options, or which license suits you best, we're here to assist. Please reach out to us at sales@theinsightpartners.com, and one of our representatives will get in touch promptly.
Yes, a billing invoice will be automatically generated and sent to your registered email upon successful completion of your purchase.
If you need the invoice in a specific format or require additional details (such as company name, GST, or VAT information), feel free to contact us, and we'll be happy to assist.
Yes, certainly.
If you encounter any difficulties accessing or receiving your report, our support team is ready to assist you. Simply reach out to us via email or live chat with your order information, and we'll ensure the issue is resolved quickly so you can access your report without interruption.
The Insight Partners performs research in 4 major stages: Data Collection & Secondary Research, Primary Research, Data Analysis and Data Triangulation & Final Review.
- Data Collection and Secondary Research:
As a market research and consulting firm operating from a decade, we have published many reports and advised several clients across the globe. First step for any study will start with an assessment of currently available data and insights from existing reports. Further, historical and current market information is collected from Investor Presentations, Annual Reports, SEC Filings, etc., and other information related to company’s performance and market positioning are gathered from Paid Databases (Factiva, Hoovers, and Reuters) and various other publications available in public domain.
Several associations trade associates, technical forums, institutes, societies and organizations are accessed to gain technical as well as market related insights through their publications such as research papers, blogs and press releases related to the studies are referred to get cues about the market. Further, white papers, journals, magazines, and other news articles published in the last 3 years are scrutinized and analyzed to understand the current market trends.
- Primary Research:
The primarily interview analysis comprise of data obtained from industry participants interview and answers to survey questions gathered by in-house primary team.
For primary research, interviews are conducted with industry experts/CEOs/Marketing Managers/Sales Managers/VPs/Subject Matter Experts from both demand and supply side to get a 360-degree view of the market. The primary team conducts several interviews based on the complexity of the markets to understand the various market trends and dynamics which makes research more credible and precise.
A typical research interview fulfils the following functions:
- Provides first-hand information on the market size, market trends, growth trends, competitive landscape, and outlook
- Validates and strengthens in-house secondary research findings
- Develops the analysis team’s expertise and market understanding
Primary research involves email interactions and telephone interviews for each market, category, segment, and sub-segment across geographies. The participants who typically take part in such a process include, but are not limited to:
- Industry participants: VPs, business development managers, market intelligence managers and national sales managers
- Outside experts: Valuation experts, research analysts and key opinion leaders specializing in the electronics and semiconductor industry.
Below is the breakup of our primary respondents by company, designation, and region:

Once we receive the confirmation from primary research sources or primary respondents, we finalize the base year market estimation and forecast the data as per the macroeconomic and microeconomic factors assessed during data collection.
- Data Analysis:
Once data is validated through both secondary as well as primary respondents, we finalize the market estimations by hypothesis formulation and factor analysis at regional and country level.
- 3.1 Macro-Economic Factor Analysis:
We analyse macroeconomic indicators such the gross domestic product (GDP), increase in the demand for goods and services across industries, technological advancement, regional economic growth, governmental policies, the influence of COVID-19, PEST analysis, and other aspects. This analysis aids in setting benchmarks for various nations/regions and approximating market splits. Additionally, the general trend of the aforementioned components aid in determining the market's development possibilities.
- 3.2 Country Level Data:
Various factors that are especially aligned to the country are taken into account to determine the market size for a certain area and country, including the presence of vendors, such as headquarters and offices, the country's GDP, demand patterns, and industry growth. To comprehend the market dynamics for the nation, a number of growth variables, inhibitors, application areas, and current market trends are researched. The aforementioned elements aid in determining the country's overall market's growth potential.
- 3.3 Company Profile:
The “Table of Contents” is formulated by listing and analyzing more than 25 - 30 companies operating in the market ecosystem across geographies. However, we profile only 10 companies as a standard practice in our syndicate reports. These 10 companies comprise leading, emerging, and regional players. Nonetheless, our analysis is not restricted to the 10 listed companies, we also analyze other companies present in the market to develop a holistic view and understand the prevailing trends. The “Company Profiles” section in the report covers key facts, business description, products & services, financial information, SWOT analysis, and key developments. The financial information presented is extracted from the annual reports and official documents of the publicly listed companies. Upon collecting the information for the sections of respective companies, we verify them via various primary sources and then compile the data in respective company profiles. The company level information helps us in deriving the base number as well as in forecasting the market size.
- 3.4 Developing Base Number:
Aggregation of sales statistics (2020-2022) and macro-economic factor, and other secondary and primary research insights are utilized to arrive at base number and related market shares for 2022. The data gaps are identified in this step and relevant market data is analyzed, collected from paid primary interviews or databases. On finalizing the base year market size, forecasts are developed on the basis of macro-economic, industry and market growth factors and company level analysis.
- Data Triangulation and Final Review:
The market findings and base year market size calculations are validated from supply as well as demand side. Demand side validations are based on macro-economic factor analysis and benchmarks for respective regions and countries. In case of supply side validations, revenues of major companies are estimated (in case not available) based on industry benchmark, approximate number of employees, product portfolio, and primary interviews revenues are gathered. Further revenue from target product/service segment is assessed to avoid overshooting of market statistics. In case of heavy deviations between supply and demand side values, all thes steps are repeated to achieve synchronization.
We follow an iterative model, wherein we share our research findings with Subject Matter Experts (SME’s) and Key Opinion Leaders (KOLs) until consensus view of the market is not formulated – this model negates any drastic deviation in the opinions of experts. Only validated and universally acceptable research findings are quoted in our reports.
We have important check points that we use to validate our research findings – which we call – data triangulation, where we validate the information, we generate from secondary sources with primary interviews and then we re-validate with our internal data bases and Subject matter experts. This comprehensive model enables us to deliver high quality, reliable data in shortest possible time.

Dec 2024
Anesthesia Machines Market
Size and Forecast (2021 - 2034), Global and Regional Share, Trend, and Growth Opportunity Analysis Report Coverage: By Product (Advanced Anesthesia Machines, Basic Anesthesia Machines, and Consumables), Customer (Small Hospitals & Nursing Home, Standalone Hospitals, Tertiary Care Hospitals, and Hospital Chain), End User (Anaesthesiologists, Critical Care Specialists, and Others), and Geography (North America, Europe, Asia Pacific, Middle East and Africa, and South and Central America)
Dec 2024
Hospital at Home Market
Size and Forecast (2021 - 2034), Global and Regional Share, Trend, and Growth Opportunity Analysis Report Coverage: By Component (Equipment & Devices and Software & Services), Service Type (Acute Care at Home, Chronic Disease Management at Home, Post Acute or Transitional Care, Palliative Care and Hospice Care, and Rehabilitation Services), Delivery Mode (Remote Monitoring and Telehealth, In-person Home Visits, and Hybrid Models), Patient Demographic ( Adult Patients and Pediatric Patients), Indication (Cardiovascular Conditions, Respiratory Diseases, Orthopedic and Post-Surgical Recovery, Infectious Diseases, Neurological Rehabilitation, and Others), Care Provider (Hospitals and Health Systems, Home Health Agencies, Primary Care or Physician Groups, and Private HaH Providers), and Geography (North America, Europe, Asia Pacific, Middle East and Africa, and South and Central America)
Dec 2024
MRI-guided Focused Ultrasound Therapy Market
Size and Forecast (2021 - 2034), Global and Regional Share, Trend, and Growth Opportunity Analysis Report Coverage: By Application (Breast Cancer, Prostate Cancer, Liver Cancer, Pancreatic Cancer, Breast Lifting and Aesthetic Application, Nipple and Areola Preservation, Post Surgical Applications, and Others), End User (Healthcare Facilities, Diagnostic Imaging Centers, and Research Centers), and Geography (North America, Europe, Asia Pacific, Middle East and Africa, and South and Central America)
Dec 2024
Drug Delivery Devices Contract Manufacturing Market
Size and Forecast (2021 - 2034), Global and Regional Share, Trend, and Growth Opportunity Analysis Report Coverage: By Device Type (Infusion Devices and Administration Set, Syringes, Inhalers, Autoinjectors, and Pen Injectors), Service Type (Full-device Manufacturing, Sub-assembly and Components, and Materials-specific Services), and Geography (North America, Europe, Asia Pacific, Middle East and Africa, and South and Central America)
Dec 2024
IVD Devices Contract Manufacturing Market
Size and Forecast (2021 - 2034), Global and Regional Share, Trend, and Growth Opportunity Analysis Report Coverage: By Service Type (Full-device Manufacturing, Sub-assembly and Components, and Materials-specific Services), Device Type (IVD consumables, IVD equipment), and Geography (North America, Europe, Asia Pacific, Middle East and Africa, and South and Central America)
Dec 2024
Gene Therapy CDMO Market
Size and Forecast (2021 - 2034), Global and Regional Share, Trend, and Growth Opportunity Analysis Report Coverage: By Service Type (Drug Development and Manufacturing, Testing and Regulatory Services, and Other Service Types), End User (Pharmaceutical Companies, Biopharmaceutical Companies, and Other End Users), and Geography (North America, Europe, Asia Pacific, Middle East and Africa, and South and Central America)
Dec 2024
RT-PCR Market
Size and Forecast (2021 - 2031), Global and Regional Share, Trend, and Growth Opportunity Analysis Report Coverage: By Product (Reagents & Consumables, Instruments, and Software & Services), Application (Research Application, Clinical Application, and Forensic Application), End user (Hospitals and Diagnostic Centers, Pharmaceutical and Biotechnology Companies, Research Laboratories and Academic Institutes, Forensic Laboratories, and Clinical Research Organizations)
Dec 2024
dPCR Market
Size and Forecast (2021 - 2031), Global and Regional Share, Trend, and Growth Opportunity Analysis Report Coverage: By Product (Reagents & Consumables, Instruments, and Software & Services), Application (Research Application, Clinical Application, and Forensic Application), End user (Hospitals and Diagnostic Centers, Pharmaceutical and Biotechnology Companies, Research Laboratories and Academic Institutes, Forensic Laboratories, and Clinical Research Organizations)
 Get Free Sample For