Track and Trace Solutions Market Growth and Analysis by 2030
Historic Data: 2020-2021 | Base Year: 2022 | Forecast Period: 2023-2028Track and Trace Solutions Market Size and Forecast (2020 - 2030), Global and Regional Share, Trend, and Growth Opportunity Analysis Report Coverage: By Component (Hardware and Software), Enterprise Size (SMEs and Large Enterprises), Application (Serialization and Aggregation), and Industry (Pharmaceutical, Medical Devices, Consumer Goods, Food & Beverages, and Others)
- Report Date : Mar 2024
- Report Code : TIPHE100000989
- Category : Technology, Media and Telecommunications
- Status : Published
- Available Report Formats :


- No. of Pages : 210
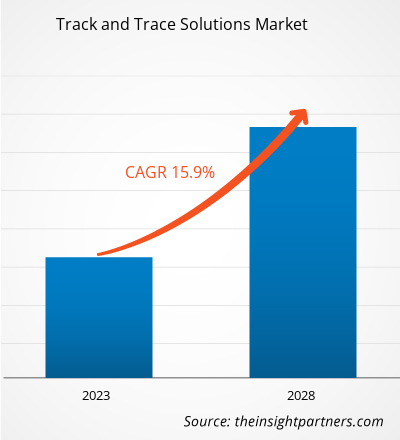
[Research Report] The track and trace solutions market size was valued at US$ 6.85 billion in 2022 and is projected to reach US$ 22.70 billion by 2030; the market is expected to register a CAGR of 16.2% from 2022 to 2030.
Market Insights and Analyst View:
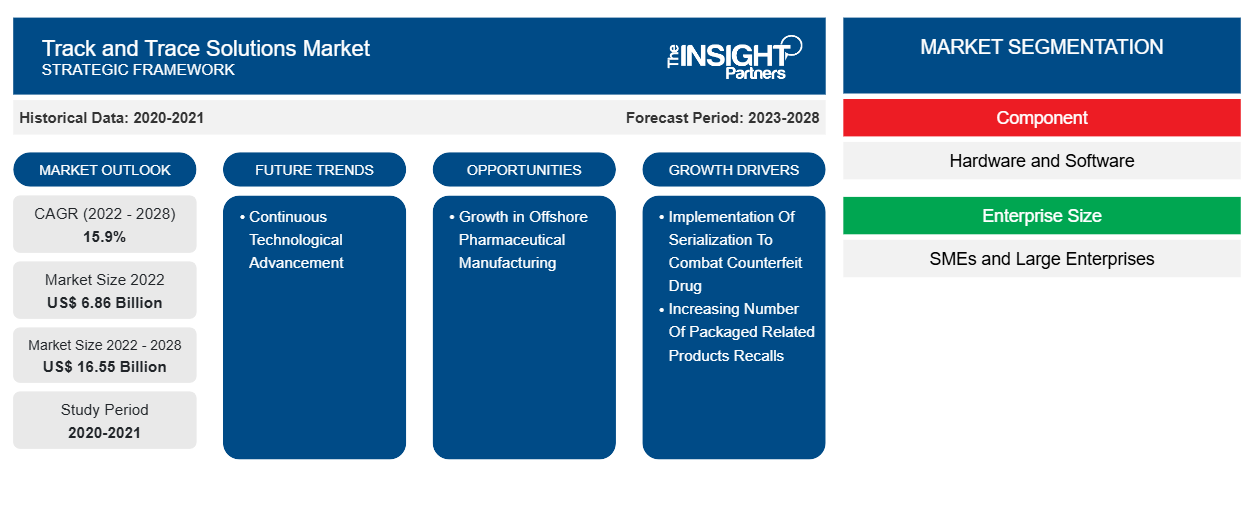
Track & trace solution aims to support compliance regulations across geographies. Once adopted, it provides a comprehensive knowledge-rich environment that enables pharmaceutical companies to easily steer through track and trace compliance mandates, manage recalls better, and increase the overall efficiency of the manufacturing process. Stringent regulations and criteria for implementation of serialization and an increasing number of packaging-related product recalls are the factors responsible for the influential growth of the market. Additionally, growth in offshore pharmaceutical manufacturing offers lucrative market opportunities for the overall market growth during the forecast period. Implementation of serialization to combat counterfeit drugs, as well as the increasing number of packaging-related product recalls, fuels the track and trace solutions market growth. Further, continuous technological advancement is expected to bring new track and trace solutions market trends in the coming years.
Track and Trace Solutions Market Drivers:
Globally, pharmaceutical companies are adhering to regulatory compliance for serialization to ensure anti-counterfeiting and traceability of drugs. Most developed and developing economies have either already laid out the regulatory roadmap for serialization or plan to implement it. The regulatory push to secure the pharmaceutical supply chain is due to the rising drug-related illegal activities and supply chain inefficiencies. Efforts are aimed at addressing drug counterfeits and unauthorized parallel supply chains, improving supply chain visibility, tracking returns or recalls, and the scarcity of data-driven tools for predicting patient behavior. A few examples of government regulations mandating the serialization of medical products include:
In the US, the Drug Supply Chain Security Act (DSCSA) started in 2013. The DSCSA defines the requirements for an interoperable electronic system to identify and trace pharmaceutical products throughout their distribution in the country. As part of the requirements, pharmaceutical products must be marked with a National Drug Code (NDC), serial number, lot number, and expiration date. The Food and Drug Administration (FDA) mandates manufacturers to track specific devices through the entire distribution chain when and if they receive an order from the FDA to implement a tracking system. These devices could belong to Class I, II, or III.
Customize This Report To Suit Your Requirement
You will get customization on any report - free of charge - including parts of this report, or country-level analysis, Excel Data pack, as well as avail great offers and discounts for start-ups & universities
Track and Trace Solutions Market: Strategic Insights
- Get Top Key Market Trends of this report.This FREE sample will include data analysis, ranging from market trends to estimates and forecasts.
In addition, the European Union (EU) has followed suit with a compliance requirement by enacting the Falsified Medicines Directive (FMD). Unit-level serialization and dispenser authentication have been mandated. Further, in Turkey, the first step for implementing serialization is the in-line printing of the relevant code and information on each unit pack. The Turkish and French Pharma plants’ early requirements revealed the risks and difficulties linked to in-line printing of a 2D code, and it took three years to deal with them. The European Union Medical Device Regulation (EU MDR) of May 2021 intends to improve the safety and performance of medical devices throughout their entire lifecycle. The rule plans to enhance the coordination of information on medical devices with better transparency and information access in the EU member states.
In 2012, India’s Directorate General of Foreign Trade (DGFT) also mandated the serialization of secondary and tertiary levels and set guidelines for reporting export shipments. Several other countries have imposed similar regulations for manufacturing and imports. In Brazil, serializing the unit and case (transport packing container) of all pharmaceutical products is mandatory. Cases will have to include information about the units they contain. Tracking of the supply chain will be required at each level, including manufacturer/importer, wholesaler, distributor, and pharmacy levels.
Governments of various countries believe that counterfeiting is an organized crime that can be tackled by implementing product serialization, and many countries are taking steps in this regard. Serialization enables running advanced analytics programs to gather deep insights into consumption patterns, geographical penetration, sales, marketing spend effectiveness, etc. According to the 2013 Drug Supply Chain Security Act, starting from November 2017, all pharmaceutical companies selling prescription drug products in the US must serialize each salable drug unit to aid tracking from manufacturer to pharmacy or doctor’s office.
According to the EU Falsified Medicines Directive (EU FMD) mandates, by February 2019, drug manufacturers conducting business in the EU market must implement serialization. Drug manufacturers are at risk for noncompliance if they fail to follow these mandates, which can lead to huge penalties ranging from paying fines for every occurrence to being barred from product launches. If companies fails to serialize, no wholesalers in the US will purchase their products. Apart from furnishing quality, visibility, and complete traceability within the supply chain, successful serialization programs will be a key differentiator and a clear competitive reward for the companies. Thus, the serialization of pharmaceutical products to avoid counterfeiting drugs in developing countries fuels the track and trace solutions market growth.
Report Segmentation and Scope:
The track and trace solutions market analysis has been carried out by considering the following segments: component, enterprise size, application, industry, and geography. By component, the market is bifurcated into hardware and software. Hardware component is further segmented into barcode scanner, radiofrequency identification reader, and others. Software component is further divided into plant manager, line controller and others. Based on enterprise size, the market is segmented into SMEs and large enterprise. Based on application, the market is divided into serialization and aggregation. Based on industry, the market is segmented into pharmaceutical, medical devices, consumer goods, food and beverages, and others. The scope of the track and trace solutions market report covers North America (the US, Canada, and Mexico), Europe (Spain, the UK, Germany, France, Italy, and the Rest of Europe), Asia Pacific (South Korea, China, Japan, India, Australia, and the Rest of Asia Pacific), Middle East & Africa (South Africa, Saudi Arabia, the UAE, and the Rest of Middle East & Africa), and South & Central America (Brazil, Argentina, and the Rest of South & Central America).
Segmental Analysis:
The track and trace solutions market, by type, is bifurcated into hardware and software. The hardware component is further segmented into barcode scanner, radiofrequency identification reader, and others. The software component is further categorized into plant manager, line controller, and others. In 2022, the software segment held a larger share of the market and is expected to record a higher CAGR during 2022–2030. Track and trace software is used for various purposes and offers complete management of the entire serialization and aggregation process. The solutions provide flexibility, whether they have a single line with limited connectivity or require software for monitoring all processes across multiple production lines. The software delivers all necessary documentation and information to meet compliance. The track and trace software is used for pharmaceuticals, production, food & beverage, and seafood. Rfxcel Corp.; METTLER TOLEDO; and JDA Software Group, Inc are among the companies that offer track and trace software. The software provides unique benefits such as reduced administration and increased confidence for quality events, faster containment of quality events with a broader purview of exposed products, and protection of customers and brand image.
The track and trace solutions market, by application, is divided into serialization solutions and aggregation solutions. In 2022, the serialization solutions segment held a larger track and trace solutions market share. Moreover, the same segment is expected to record the highest CAGR during 2022–2030. Serialization refers to the assigning of a predetermined type of coding to all product items, tagging it with a unique identity in order to track the product at virtually any moment, and can be traced to its location at any stage of the production, supply chain and/or marketing chain it is presently involved in, or any point during the product life cycle. Nowadays, the supply chain for all industries is becoming longer and more complex than ever. Hence, incidences such as counterfeiting, gray marketing, and product mix-ups are rising rapidly. Most of the countries with a series of regulatory requirements for global compliance for industries such as pharmaceutical, medical devices, and life science are in need of a standardized method in order to ensure and prove end-to-end product integrity. Serialization solutions for track and trace systems have increased accountability in the pharmaceutical and medical devices supply chain by directly addressing these issues. In the global pharmaceutical industry, the ability to track and trace pharmaceutical drugs in the supply chain has been regulatory vital and evolving in order to improve drug safety and avoid counterfeits. With the help of a serialization solution, one can encode the products with an expiration date, lot code, serial number, GTIN, a 2D matrix code, and a GSI-DataMatrix symbol in order to track products for anti-counterfeiting efforts. Serialization also allows for tracking and tracing the product throughout the supply chain and provides brand and consumer protection, along with regulatory compliance.
Based on enterprise size, the global track and trace solutions market is divided into SMEs and large enterprises. In 2022, the large enterprise segment held a larger market share. The SMEs segment is expected to record a higher CAGR during 2022–2030.
The track and trace solutions market, by industry, is segmented into pharmaceutical, medical devices, consumer goods, food & beverages, and others. In 2022, the pharmaceutical segment held the largest share of the market and is expected to record the highest CAGR during 2022–2030.
Regional Analysis:
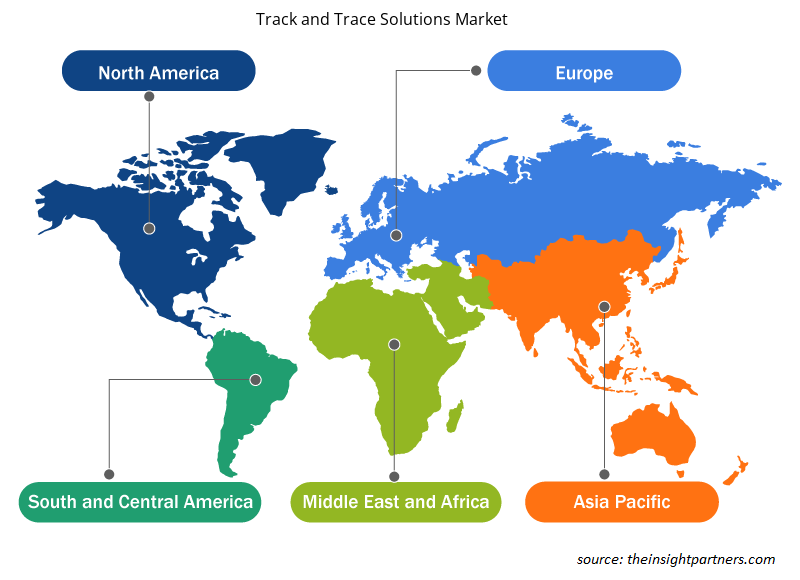
Geographically, the market is categorized into North America, Europe, Asia Pacific, the Middle East & Africa, and South & Central America. North America is the largest contributor to the global market. Asia Pacific is predicted to register the highest CAGR in the market during 2022–2030. North America held the largest share of the global track and trace solutions market in 2022 owing to the presence of large players launching innovative product launches and technological advancements in track and trace solutions. In North America, the US held the largest share of the track and trace solutions market share in 2022.
Track and Trace Solutions Market Regional Insights
The regional trends and factors influencing the Track and Trace Solutions Market throughout the forecast period have been thoroughly explained by the analysts at The Insight Partners. This section also discusses Track and Trace Solutions Market segments and geography across North America, Europe, Asia Pacific, Middle East and Africa, and South and Central America.
- Get the Regional Specific Data for Track and Trace Solutions Market
Track and Trace Solutions Market Report Scope
| Report Attribute | Details |
|---|---|
| Market size in 2022 | US$ 6.86 Billion |
| Market Size by 2028 | US$ 16.55 Billion |
| Global CAGR (2022 - 2028) | 15.9% |
| Historical Data | 2020-2021 |
| Forecast period | 2023-2028 |
| Segments Covered |
By Component
|
| Regions and Countries Covered | North America
|
| Market leaders and key company profiles |
Track and Trace Solutions Market Players Density: Understanding Its Impact on Business Dynamics
The Track and Trace Solutions Market is growing rapidly, driven by increasing end-user demand due to factors such as evolving consumer preferences, technological advancements, and greater awareness of the product's benefits. As demand rises, businesses are expanding their offerings, innovating to meet consumer needs, and capitalizing on emerging trends, which further fuels market growth.
Market players density refers to the distribution of firms or companies operating within a particular market or industry. It indicates how many competitors (market players) are present in a given market space relative to its size or total market value.
Major Companies operating in the Track and Trace Solutions Market are:
- ACG
- Axway Software SA
- Antares Vision SPA
- Markem-Imaje AG
- Mettler-Toledo International Inc
Disclaimer: The companies listed above are not ranked in any particular order.
- Get the Track and Trace Solutions Market top key players overview
Industry Developments and Future Opportunities:
The track and trace solutions market forecast is estimated on the basis of various secondary and primary research findings, such as key company publications, association data, and databases. Strategies by key players operating in the track and trace solutions market are listed below:
- In November 2023, Sys-Tech Solutions Inc. announced the launch of the UniSecure platform into the market. The platform is a comprehensive product security solution that detects diversion and counterfeiting. It offers unique product identification, traceability, and product verification through smartphones throughout the supply chain process. The newly launched platform caters to pharmaceutical, nutraceutical, medical products, skincare, and other markets.
- In October 2022, Zebra Technologies Corporation announced the new PartnerConnect Location and Tracking Specialization for partners focused on selling RFID and real-time location systems (RTLS). Developed as a strategic component of Zebra’s award-winning PartnerConnect program, the new Location and Tracking Specialization provides resellers with the tools they need to drive RFID and RTLS sales and help businesses successfully deploy these solutions for transformational business benefits.
Competitive Landscape and Key Companies:
ACG, Axway Software SA, Antares Vision SPA, Markem-Imaje AG, Mettler-Toledo International Inc, Optel Group, SEA Vision Grp, Siemens AG, TraceLink Inc, and Zebra Technologies Corp are among the prominent players profiled in the track and trace solutions market report. In addition, several other players have been studied and analyzed during the study to get a holistic view of the market and its ecosystem. These companies focus on geographic expansions and product launches to meet the growing demand from consumers worldwide and increase their product range in specialty portfolios. Their global presence allows them to serve a large customer base, subsequently facilitating market expansion.
Frequently Asked Questions
What are the driving and restraining factors for the track & trace solutions market?
Implementation of serialization to combat counterfeit drugs and increasing number of packaging-related product recalls propel the market growth. However, the high cost of products and implementation are hampering the growth of the market.
What is track & trace solutions?
Track and trace solution aims to support compliance regulations across geographies. Once adopted, it provides a comprehensive knowledge-rich environment that enables pharmaceutical companies to easily steer through track and trace compliance mandates, manages recalls better, and increases the overall efficiency of the manufacturing process. Further, a track and trace solution offer numerous benefits involving purchase order numbers, container numbers, bill of lading numbers, customer information, item counts, weight, status and delivery date, freight charges, and many more.
Which segment is dominating the track & trace solutions market?
The track & trace solutions market, by type, is bifurcated into hardware and software. In 2022, the software segment held a larger share of the market and is expected to record a higher CAGR during 2022–2030.
The market, by application, is segmented into serialization solutions and aggregation solutions. In 2022, the serialization solutions segment held the largest track & trace solutions market share. Moreover, the same segment is expected to record the highest CAGR during 2022–2030.
Based on enterprise size, the global track & trace solutions market is divided into SMEs and large enterprise. In 2022, the large enterprise segment held the largest market share. The SMEs segment is expected to record the highest CAGR during 2022–2030. The track & trace solutions market, by industry, is segmented into pharmaceuticals, medical devices, consumer goods, food & beverages, and others. In 2022, the pharmaceuticals segment held a larger share of the market and is expected to record a higher CAGR during 2022–2030.
Based on geography, the track & trace solutions market is segmented into North America (the US, Canada, and Mexico), Europe (the UK, Germany, France, Italy, Spain, and the Rest of Europe), Asia Pacific (China, Japan, India, South Korea, Australia, and the Rest of Asia Pacific), the Middle East & Africa (the UAE, Saudi Arabia, South Africa, and Rest of the Middle East & Africa), and South & Central America (Brazil, Argentina, and the Rest of South & Central America). North America is the largest contributor to the growth of the global track & trace solutions market. Asia Pacific is expected to register the highest CAGR in the track & trace solutions market during 2022–2030.
Who are the major players in market the track & trace solutions market?
The track & trace solutions market majorly consists of the players such ACG, Axway Software SA, Antares Vision SPA, Markem-Imaje AG, Mettler-Toledo International Inc, Optel Group, SEA Vision Grp, Siemens AG, TraceLink Inc, and Zebra Technologies Corp.

Market Research & Consulting
- Historical Analysis (2 Years), Base Year, Forecast (7 Years) with CAGR
- PEST and SWOT Analysis
- Market Size Value / Volume - Global, Regional, Country
- Industry and Competitive Landscape
- Excel Dataset
- Parking Meter Apps Market
- eSIM Market
- Advanced Distributed Management System Market
- Online Exam Proctoring Market
- Electronic Data Interchange Market
- Barcode Software Market
- Maritime Analytics Market
- Cloud Manufacturing Execution System (MES) Market
- Robotic Process Automation Market
- Digital Signature Market
Testimonials
I wish to appreciate your support and the professionalism you displayed in the course of attending to my request for information regarding to infectious disease IVD market in Nigeria. I appreciate your patience, your guidance, and the fact that you were willing to offer a discount, which eventually made it possible for us to close a deal. I look forward to engaging The Insight Partners in the future, all thanks to the impression you have created in me as a result of this first encounter.
DR CHIJIOKE ONYIA MANAGING DIRECTOR, PineCrest Healthcare Ltd.The Insight Partners delivered insightful, well-structured market research with strong domain expertise. Their team was professional and responsive throughout. The user-friendly website made accessing industry reports seamless. We highly recommend them for reliable, high-quality research services
YUKIHIKO ADACHI CEO, Deep Blue, LLC.We worked with The Insight Partners for an important market study and forecast. They gave us clear insights into opportunities and risks, which helped shape our plans. Their research was easy to use and based on solid data. It helped us make smart, confident decisions. We highly recommend them.
PIYUSH NAGPAL Sr. Vice President, Market ResearchThe research report delivered details on drivers and restraints, trends, and opportunities, along with strategic activities in the market. Previously, we were struggling to get reliable information.
Manager Medical Devices ManufacturingReason to Buy
- Informed Decision-Making
- Understanding Market Dynamics
- Competitive Analysis
- Identifying Emerging Markets
- Customer Insights
- Market Forecasts
- Risk Mitigation
- Boosting Operational Efficiency
- Strategic Planning
- Investment Justification
- Tracking Industry Innovations
- Aligning with Regulatory Trends
Yes! We provide a free sample of the report, which includes Report Scope (Table of Contents), report structure, and selected insights to help you assess the value of the full report. Please click on the "Download Sample" button or contact us to receive your copy.
Absolutely — analyst assistance is part of the package. You can connect with our analyst post-purchase to clarify report insights, methodology or discuss how the findings apply to your business needs.
Once your order is successfully placed, you will receive a confirmation email along with your invoice.
• For published reports: You’ll receive access to the report within 4–6 working hours via a secured email sent to your email.
• For upcoming reports: Your order will be recorded as a pre-booking. Our team will share the estimated release date and keep you informed of any updates. As soon as the report is published, it will be delivered to your registered email.
We offer customization options to align the report with your specific objectives. Whether you need deeper insights into a particular region, industry segment, competitor analysis, or data cut, our research team can tailor the report accordingly. Please share your requirements with us, and we’ll be happy to provide a customized proposal or scope.
The report is available in either PDF format or as an Excel dataset, depending on the license you choose.
The PDF version provides the full analysis and visuals in a ready-to-read format. The Excel dataset includes all underlying data tables for easy manipulation and further analysis.
Please review the license options at checkout or contact us to confirm which formats are included with your purchase.
Our payment process is fully secure and PCI-DSS compliant.
We use trusted and encrypted payment gateways to ensure that all transactions are protected with industry-standard SSL encryption. Your payment details are never stored on our servers and are handled securely by certified third-party processors.
You can make your purchase with confidence, knowing your personal and financial information is safe with us.
Yes, we do offer special pricing for bulk purchases.
If you're interested in purchasing multiple reports, we’re happy to provide a customized bundle offer or volume-based discount tailored to your needs. Please contact our sales team with the list of reports you’re considering, and we’ll share a personalized quote.
Yes, absolutely.
Our team is available to help you make an informed decision. Whether you have questions about the report’s scope, methodology, customization options, or which license suits you best, we’re here to assist. Please reach out to us at sales@theinsightpartners.com, and one of our representatives will get in touch promptly.
Yes, a billing invoice will be automatically generated and sent to your registered email upon successful completion of your purchase.
If you need the invoice in a specific format or require additional details (such as company name, GST, or VAT information), feel free to contact us, and we’ll be happy to assist.
Yes, certainly.
If you encounter any difficulties accessing or receiving your report, our support team is ready to assist you. Simply reach out to us via email or live chat with your order information, and we’ll ensure the issue is resolved quickly so you can access your report without interruption.


The List of Companies - Track & Trace Solution Market
- ACG
- Axway Software SA
- Antares Vision SPA
- Markem-Imaje AG
- Mettler-Toledo International Inc
- Optel Group
- SEA Vision Grp
- Siemens AG
- TraceLink Inc
- Zebra Technologies Corp


 Get Free Sample For