Visual Analytics Market Key Companies and SWOT Analysis by 2025
Historic Data: 2015-2016 | Base Year: 2017 | Forecast Period: 2018-2025Visual Analytics Market to 2025 - Global Analysis and Forecasts by Deployment Model (On-Premises and Cloud); Business Function (Sales and Marketing, Operations, Finance, Supply Chain, Information Technology, CRM, and Human Resources); Vertical (Retail & Consumer Goods, IT & Telecom, BFSI, Manufacturing, Energy & Utilities, Healthcare, and Government)
- Report Date : Oct 2018
- Report Code : TIPTE100000740
- Category : Technology, Media and Telecommunications
- Status : Published
- Available Report Formats :


- No. of Pages : 154
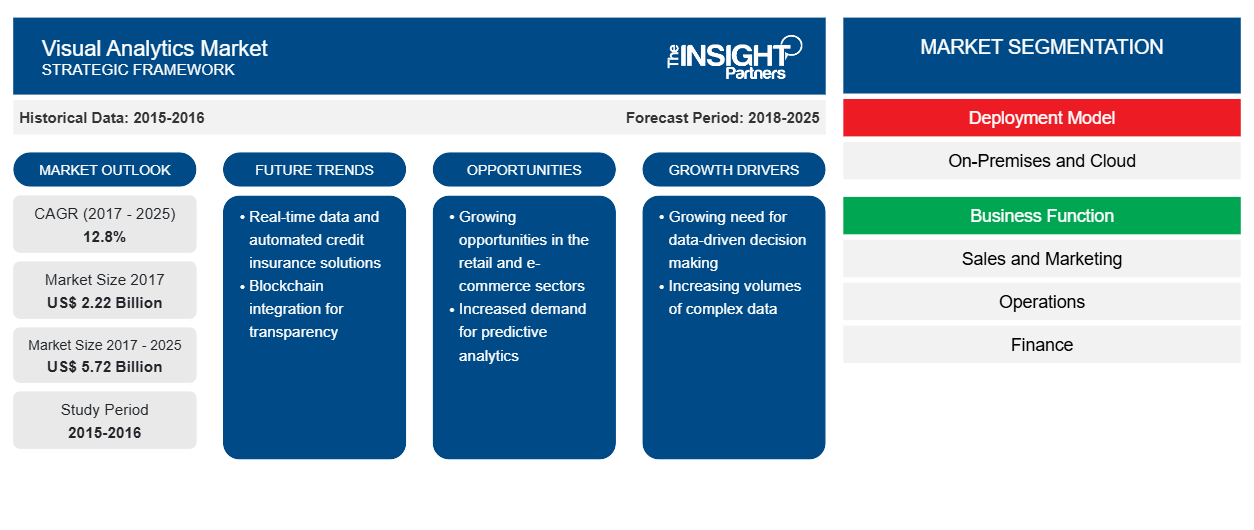
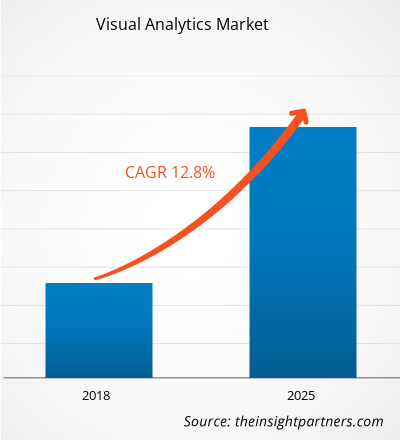
[Research Report] The visual analytics market was valued at US$ 2215.0 million in 2017 and is projected to reach US$ 5718.6 million by 2025. The Visual analytics market is expected to grow at a CAGR of 12.8% during the forecast period of 2017 to 2025.
Combining visualization with interactive analysis to explore large data set is the wholesome aim of a Visual Analytics solutions. In other words, visual analytics is the science of analytical reasoning facilitated by interactive visual interfaces. To be more precise, visual analytics is an iterative process that involves information gathering, data preprocessing, knowledge representation, interaction and decision making. The ultimate goal is to gain insight in the problem at hand which is described by vast amounts of scientific, forensic or business data from heterogeneous sources. To reach this goal, visual analytics combines the strengths of machines with those of humans. On the one hand, methods from knowledge discovery in databases (KDD), statistics and mathematics are the driving force on the automatic analysis side, while on the other hand human capabilities to perceive, relate and conclude turn visual analytics into a very promising field of research. Today, just data visualization is not sufficient, and the companies are looking forward to data driven analytics capabilities integrated with their data visualization. Visual analytics can be explained as the formation of intellectual visual metaphors combined with manual information interaction.
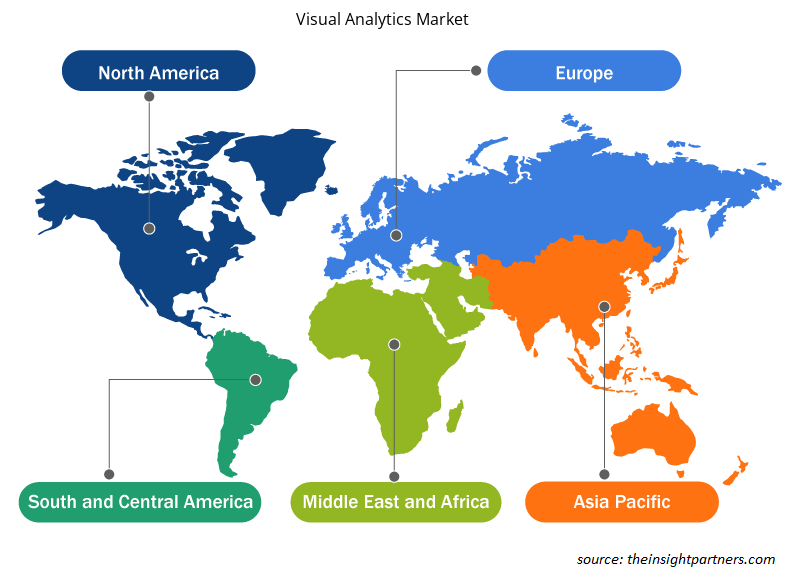
The market for visual analytics has been segmented on the basis of deployment model, business function and vertical. Based on deployment model, the visual analytics market has been segmented into on-premises and cloud. Based on business function, the visual analytics market has been segmented into sales and marketing, operations, finance, supply chain, information technology, CRM, and human resources. The market is further segmented on the basis vertical into retail & consumer goods, IT & telecom, BFSI, manufacturing, energy & utilities, healthcare, and government. Geographically, the market is fragmented into five regions, including North America, Europe, Asia-Pacific, Middle East & Africa, and South America.
Customize This Report To Suit Your Requirement
You will get customization on any report - free of charge - including parts of this report, or country-level analysis, Excel Data pack, as well as avail great offers and discounts for start-ups & universities
Visual Analytics Market: Strategic Insights
- Get Top Key Market Trends of this report.This FREE sample will include data analysis, ranging from market trends to estimates and forecasts.
Visual Analytics Market Insights
Prevalence of AI and Machine learning globally
The biggest trend impacting data visualization and analytics innovation today is the prevalence of artificial intelligence (AI) and machine learning. While it may sound scary to IT departments and analysts who are hesitant to relinquish human control, analytic platforms that include AI and ML capabilities are actually going to serve as a highly effective assistant to modern analysts. While there might be concern over being replaced, machine learning will actually supercharge analysts and make them more efficient, more precise, and more impactful to the business. Instead of fearing machine learning technology, embrace the opportunities it presents.
Deployment Model -Based Market Insights
The visual analytics comprises of cloud, and on-premise deployment model. The deployment model for the visual analytics is a critical decision for deciding upon a particular model to opt for. Enterprises prefer both cloud as well as on-premise mode of deployment depending upon various factors. The demand for cloud-based visual analytics is preferred as the best deployment type by many SMEs as it comes at inexpensive rates.
Business Function -Based Market Insights
A paradigm shift in the business approaches has led to rising demands for the integration of various analytics software in the business processes by various industry verticals, across the globe and in particular in the advanced regions. The business users today have taken leaps from the conventional data management, processing and analyzing techniques. Different business functions in a particular sector require data to be analyzed for various purposes.
Verticals -Based Market Insights
The basic function of any visual analytic tool is to take the complex data and present it to the user in such a manner that it would be highly interactive and easy to comprehend. Visual analytic tools are required to perform two critical tasks that include visualization of the data and then analysis of that data. Simple visualization won’t suffice the issues of simplifying a large volume of data. User friendliness of these tools, cost-effectiveness, the ability of customization of visual analytics tools, interactive user interfaces, dashboards, and filtering options are some of the parameters that help the end-users decide upon choosing a particular visual analytic tool for their business function..
Players operating in the Visual analytics market focus on strategies, such as market initiatives, acquisitions, and product launches, to maintain their positions in the visual analytics market. A few developments by key players of the visual analytics market are:
In September 2018, TIBCO introduced A(X) Experience for TIBCO Spotfire which will permit real-time visual analytics on data streams allow real-time awareness and actions.
In September 2018, SAP SE introduced SAP Analytics Cloud, it is one simple cloud for all analytics. This analytic cloud offers its customers with all-in-one integration of data visualization, predictive, and planning capabilities.
Visual Analytics Market Regional Insights
The regional trends and factors influencing the Visual Analytics Market throughout the forecast period have been thoroughly explained by the analysts at The Insight Partners. This section also discusses Visual Analytics Market segments and geography across North America, Europe, Asia Pacific, Middle East and Africa, and South and Central America.
- Get the Regional Specific Data for Visual Analytics Market
Visual Analytics Market Report Scope
| Report Attribute | Details |
|---|---|
| Market size in 2017 | US$ 2.22 Billion |
| Market Size by 2025 | US$ 5.72 Billion |
| Global CAGR (2017 - 2025) | 12.8% |
| Historical Data | 2015-2016 |
| Forecast period | 2018-2025 |
| Segments Covered |
By Deployment Model
|
| Regions and Countries Covered | North America
|
| Market leaders and key company profiles |
Visual Analytics Market Players Density: Understanding Its Impact on Business Dynamics
The Visual Analytics Market is growing rapidly, driven by increasing end-user demand due to factors such as evolving consumer preferences, technological advancements, and greater awareness of the product's benefits. As demand rises, businesses are expanding their offerings, innovating to meet consumer needs, and capitalizing on emerging trends, which further fuels market growth.
Market players density refers to the distribution of firms or companies operating within a particular market or industry. It indicates how many competitors (market players) are present in a given market space relative to its size or total market value.
Major Companies operating in the Visual Analytics Market are:
- Tableau Software
- SAP SE
- Qlik Technologies
- TIBCO Software
- ADVIZOR Solutions Pvt. Ltd
Disclaimer: The companies listed above are not ranked in any particular order.
- Get the Visual Analytics Market top key players overview
Visual Analytics Market – by Deployment Model
- On-Premise
- Cloud
Visual Analytics Market – by Business Function
- Sales and Marketing
- Operations
- Finance
- Supply Chain
- Information Technology
- CRM
- Human Resources
- Others
Visual Analytics Market – by Verticals
- Retail & Consumer Goods Market
- IT & Telecom
- BFSI
- Manufacturing
- Energy & Utilities
- Others
- Healthcare
- Government
Visual Analytics Market – by Geography
North America
- US
- Canada
- Mexico
Europe
- France
- Germany
- Spain
- UK
- Italy
Asia Pacific (APAC)
- China
- India
- Japan
- Australia
MEA
- Saudi Arabia
- UAE
- South Africa
SAM
- Brazil
Visual Analytics Market – Company Profiles
- ADVIZOR Solutions, Inc.
- Alteryx, Inc.
- IBM Corporation
- MicroStrategy Incorporated
- Oracle Corporation
- QLIK TECHNOLOGIES INC.
- SAP Se
- SAS Institute Inc.
- Tableau Software
- TIBCO Software Inc.

Market Research & Consulting
- Historical Analysis (2 Years), Base Year, Forecast (7 Years) with CAGR
- PEST and SWOT Analysis
- Market Size Value / Volume - Global, Regional, Country
- Industry and Competitive Landscape
- Excel Dataset
- Parking Meter Apps Market
- eSIM Market
- Advanced Distributed Management System Market
- Online Exam Proctoring Market
- Electronic Data Interchange Market
- Barcode Software Market
- Maritime Analytics Market
- Cloud Manufacturing Execution System (MES) Market
- Robotic Process Automation Market
- Digital Signature Market
Testimonials
I wish to appreciate your support and the professionalism you displayed in the course of attending to my request for information regarding to infectious disease IVD market in Nigeria. I appreciate your patience, your guidance, and the fact that you were willing to offer a discount, which eventually made it possible for us to close a deal. I look forward to engaging The Insight Partners in the future, all thanks to the impression you have created in me as a result of this first encounter.
DR CHIJIOKE ONYIA MANAGING DIRECTOR, PineCrest Healthcare Ltd.The Insight Partners delivered insightful, well-structured market research with strong domain expertise. Their team was professional and responsive throughout. The user-friendly website made accessing industry reports seamless. We highly recommend them for reliable, high-quality research services
YUKIHIKO ADACHI CEO, Deep Blue, LLC.We worked with The Insight Partners for an important market study and forecast. They gave us clear insights into opportunities and risks, which helped shape our plans. Their research was easy to use and based on solid data. It helped us make smart, confident decisions. We highly recommend them.
PIYUSH NAGPAL Sr. Vice President, Market ResearchThe research report delivered details on drivers and restraints, trends, and opportunities, along with strategic activities in the market. Previously, we were struggling to get reliable information.
Manager Medical Devices ManufacturingReason to Buy
- Informed Decision-Making
- Understanding Market Dynamics
- Competitive Analysis
- Identifying Emerging Markets
- Customer Insights
- Market Forecasts
- Risk Mitigation
- Boosting Operational Efficiency
- Strategic Planning
- Investment Justification
- Tracking Industry Innovations
- Aligning with Regulatory Trends
Yes! We provide a free sample of the report, which includes Report Scope (Table of Contents), report structure, and selected insights to help you assess the value of the full report. Please click on the "Download Sample" button or contact us to receive your copy.
Absolutely — analyst assistance is part of the package. You can connect with our analyst post-purchase to clarify report insights, methodology or discuss how the findings apply to your business needs.
Once your order is successfully placed, you will receive a confirmation email along with your invoice.
• For published reports: You’ll receive access to the report within 4–6 working hours via a secured email sent to your email.
• For upcoming reports: Your order will be recorded as a pre-booking. Our team will share the estimated release date and keep you informed of any updates. As soon as the report is published, it will be delivered to your registered email.
We offer customization options to align the report with your specific objectives. Whether you need deeper insights into a particular region, industry segment, competitor analysis, or data cut, our research team can tailor the report accordingly. Please share your requirements with us, and we’ll be happy to provide a customized proposal or scope.
The report is available in either PDF format or as an Excel dataset, depending on the license you choose.
The PDF version provides the full analysis and visuals in a ready-to-read format. The Excel dataset includes all underlying data tables for easy manipulation and further analysis.
Please review the license options at checkout or contact us to confirm which formats are included with your purchase.
Our payment process is fully secure and PCI-DSS compliant.
We use trusted and encrypted payment gateways to ensure that all transactions are protected with industry-standard SSL encryption. Your payment details are never stored on our servers and are handled securely by certified third-party processors.
You can make your purchase with confidence, knowing your personal and financial information is safe with us.
Yes, we do offer special pricing for bulk purchases.
If you're interested in purchasing multiple reports, we’re happy to provide a customized bundle offer or volume-based discount tailored to your needs. Please contact our sales team with the list of reports you’re considering, and we’ll share a personalized quote.
Yes, absolutely.
Our team is available to help you make an informed decision. Whether you have questions about the report’s scope, methodology, customization options, or which license suits you best, we’re here to assist. Please reach out to us at sales@theinsightpartners.com, and one of our representatives will get in touch promptly.
Yes, a billing invoice will be automatically generated and sent to your registered email upon successful completion of your purchase.
If you need the invoice in a specific format or require additional details (such as company name, GST, or VAT information), feel free to contact us, and we’ll be happy to assist.
Yes, certainly.
If you encounter any difficulties accessing or receiving your report, our support team is ready to assist you. Simply reach out to us via email or live chat with your order information, and we’ll ensure the issue is resolved quickly so you can access your report without interruption.


The List of Companies
1. Tableau Software
2. SAP SE
3. Qlik Technologies
4. TIBCO Software
5. ADVIZOR Solutions Pvt. Ltd
6. SAS Institute
7. Oracle Corporation
8. MicroStrategy
9. IBM Corporation
10. Alteryx, Inc.


 Get Free Sample For