Panoramica del mercato del software aziendale G Suite, crescita, tendenze, analisi, rapporto di ricerca (2023-2031)
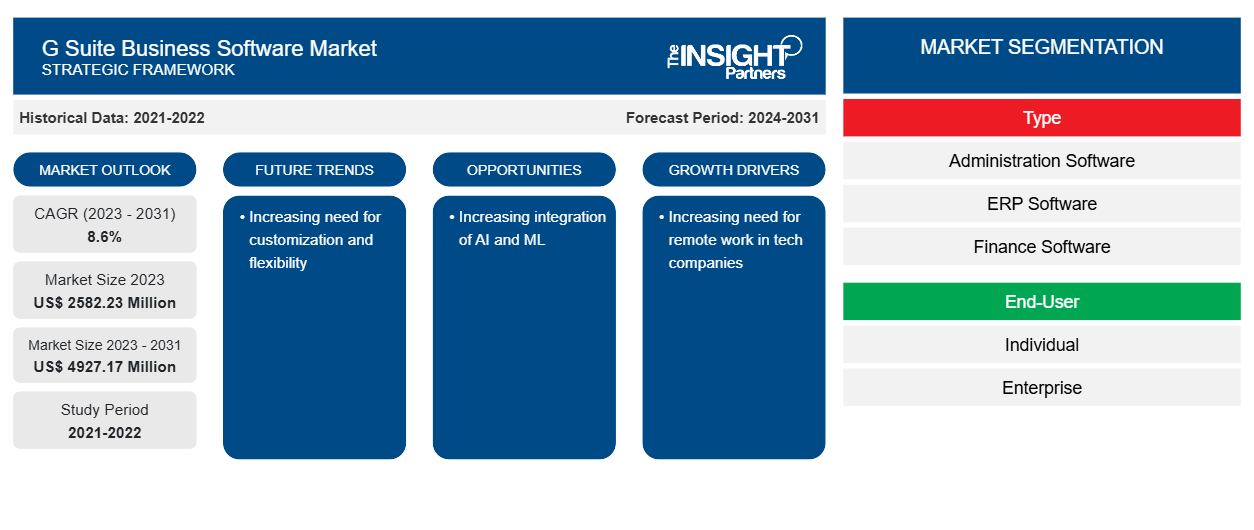
Dati storici : 2021-2022 | Anno base : 2023 | Periodo di previsione : 2024-2031Dimensioni e previsioni del mercato del software aziendale G Suite (2021-2031), quota globale e regionale, trend e opportunità di crescita. Copertura del rapporto di analisi: per tipo (software di amministrazione, software ERP, software finanziario, software per le risorse umane, altri); utente finale (singolo, azienda, altri) e area geografica.
- Stato : Dati rilasciati
- Codice del report : TIPRE00013586
- Categoria : Tecnologia, media e telecomunicazioni
- Numero di pagine : 150
- Formati di report disponibili :


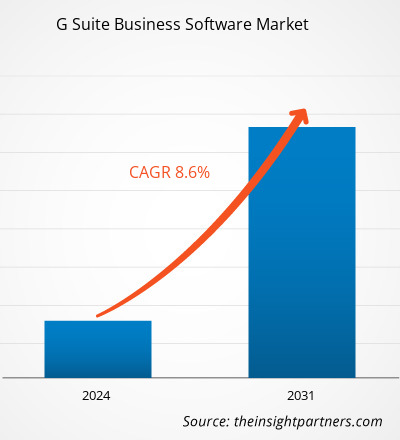
Si prevede che la dimensione del mercato del software aziendale G Suite raggiungerà i 4927,17 milioni di dollari entro il 2031, rispetto ai 2582,23 milioni di dollari del 2023. Si prevede che il mercato registrerà un CAGR dell'8,6% nel periodo 2023-2031. La crescente necessità di personalizzazione e flessibilità rimarrà probabilmente una tendenza chiave nel mercato.CAGR of 8.6% during 2023–2031. The increasing need for customization and flexibility is likely to remain a key trend in the market.
Analisi di mercato del software aziendale G Suite
G Suite consente alle aziende e alle organizzazioni di utilizzare la suite di strumenti di produttività e collaborazione basati su cloud di Google alla fine dei loro processi aziendali. Vari sviluppatori e fornitori di soluzioni di terze parti offrono una governance e una gestione superiori delle soluzioni G Suite in base ai requisiti delle aziende. Calendly fornisce una soluzione per G Suite che funziona perfettamente con Google Calendar per gestire tutte le prenotazioni e le attività correlate alla pianificazione. Mixmax offre soluzioni di calendario e una piattaforma di produttività e-mail per vendite, successo dei clienti, reclutamento, operazioni di vendita, leadership e imprenditori. Le aziende di terze parti forniscono strumenti aggiuntivi per G Suite che migliorano la produttività e la gestibilità delle aziende e forniscono ai clienti requisiti personalizzati.
Panoramica del mercato del software aziendale G Suite
G Suite è una suite di applicazioni Software as a Service (SaaS) progettata e alimentata da Google. Queste app basate sul cloud si concentrano su diverse aree, come business, collaborazione, produttività e istruzione. Gmail, Docs, Sheets, Drive, Calendar, Google+, Slides, Forms, Sites, Hangouts e Keep sono i principali strumenti G Suite disponibili da Google. G Suite è una risorsa preziosa per le aziende e per i privati in tutto il mondo.
Personalizza questo report in base alle tue esigenze
Riceverai la personalizzazione gratuita di qualsiasi report, comprese parti di questo report, o analisi a livello nazionale, pacchetto dati Excel, oltre a usufruire di grandi offerte e sconti per start-up e università
Mercato del software aziendale G Suite: approfondimenti strategici
-
Scopri le principali tendenze di mercato in questo rapporto.Questo campione GRATUITO includerà analisi di dati che spaziano dalle tendenze di mercato alle stime e alle previsioni.
Driver e opportunità di mercato del software aziendale G Suite
Crescente necessità di lavoro da remoto nelle aziende tecnologiche
I datori di lavoro sono sempre più interessati a posizioni presso aziende che offrono modelli di lavoro da remoto o ibridi e sempre più datori di lavoro stanno riconoscendo questa tendenza. Dal 2021 al 2022, un rapporto del sito web di annunci di lavoro FlexJobs.com ha rivelato che gli annunci per posizioni da remoto sono aumentati dal 12% dell'anno precedente al 12%. La popolarità del lavoro da remoto è diventata un fattore importante ed è probabile che aumenti man mano che i datori di lavoro affinano le loro politiche di assunzione sul lavoro da casa. Pertanto, la crescente necessità di lavoro da remoto nelle aziende tecnologiche sta guidando il mercato del software aziendale G Suite.FlexJobs.com revealed that listings for remote positions rose from 12% the previous year to 12%. The popularity of remote work has become a major factor and is likely to rise as employers refine their employment policies on working from home. Therefore, the increasing pen need for remote work in tech companies is driving the G suite business software market.
Crescente integrazione dell’IA
Con l'aiuto di AI e ML, G Suite aggiunge strumenti di sicurezza. Diverse aziende stanno implementando il software aziendale G Suite con tecnologie AI e ML. Ad esempio, nel 2020, il gigante della ricerca ha annunciato diversi aggiornamenti a G Suite utilizzando AI, il suo set di app che assomigliano a Google Docs e Sheets ma sono su misura per l'ufficio. L'azienda lo ha annunciato durante la sua conferenza annuale Google Cloud Next a San Francisco. Pertanto, la crescente integrazione di AI con il software aziendale G Suite sta creando più opportunità per il mercato.deployoing G suite business software with AI and ML technologies. For instance, in 2020, the search giant announced several updates to G Suite by using AI, its set of apps that resemble Google Docs and Sheets but are tailored for the office. The company announced this during its annual Google Cloud Next conference in San Francisco. Therefore, the increasing integration of AI with G Suite business software is creating more opportunities for the market.
Analisi della segmentazione del rapporto di mercato del software aziendale G Suite
I segmenti chiave che hanno contribuito alla derivazione dell'analisi di mercato del software aziendale G Suite sono la tipologia e l'utente finale.
- In base al tipo, il mercato del software aziendale G Suite è suddiviso in software di amministrazione, software ERP, software finanziario, software HR e altri. Il segmento personalizzato ha detenuto una quota di mercato maggiore nel 2023.ERP software, finance software, HR software, and others. The customized segment held a larger market share in 2023.
- In base agli utenti finali, il mercato è segmentato in privati, aziende e altri.
Analisi della quota di mercato del software aziendale G Suite per area geografica
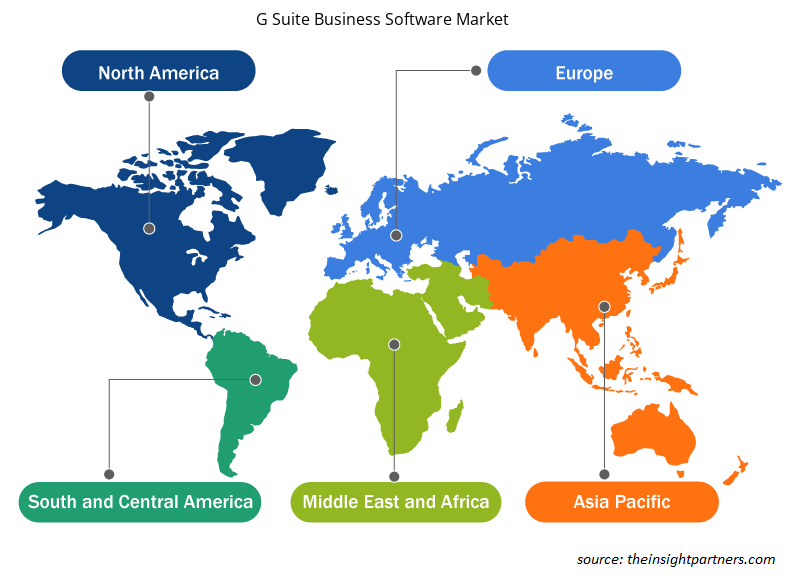
L'ambito geografico del rapporto sul mercato del software aziendale G Suite è suddiviso principalmente in cinque regioni: Nord America, Asia Pacifico, Europa, Medio Oriente e Africa, Sud e Centro America.
L'APAC domina il mercato del software aziendale G Suite. Il mercato del software aziendale G Suite in questa regione sta crescendo a causa di vari fattori, come le crescenti iniziative delle organizzazioni per migliorare la loro sicurezza e la presenza di affermati fornitori dominates the G Suite business software market. The G suite business software market in this region is growing due to various factors, such as increasing organizations' initiatives to improve their security and the presence of well-established G suite business di software aziendale G Suite .
Approfondimenti regionali sul mercato del software aziendale G Suite
Le tendenze regionali e i fattori che influenzano il mercato del software aziendale G Suite durante il periodo di previsione sono stati ampiamente spiegati dagli analisti di Insight Partners. Questa sezione discute anche i segmenti e la geografia del mercato del software aziendale G Suite in Nord America, Europa, Asia Pacifico, Medio Oriente e Africa e America meridionale e centrale.
- Ottieni i dati specifici regionali per il mercato del software aziendale G Suite
Ambito del rapporto di mercato del software aziendale G Suite
| Attributo del report | Dettagli |
|---|---|
| Dimensioni del mercato nel 2023 | 2582,23 milioni di dollari USA |
| Dimensioni del mercato entro il 2031 | 4927,17 milioni di dollari USA |
| CAGR globale (2023-2031) | 8,6% |
| Dati storici | 2021-2022 |
| Periodo di previsione | 2024-2031 |
| Segmenti coperti |
Per tipo
|
| Regioni e Paesi coperti |
America del Nord
|
| Leader di mercato e profili aziendali chiave |
|
Densità dei player del mercato del software aziendale G Suite: comprendere il suo impatto sulle dinamiche aziendali
Il mercato del software aziendale G Suite sta crescendo rapidamente, spinto dalla crescente domanda degli utenti finali dovuta a fattori quali l'evoluzione delle preferenze dei consumatori, i progressi tecnologici e una maggiore consapevolezza dei vantaggi del prodotto. Con l'aumento della domanda, le aziende stanno ampliando le loro offerte, innovando per soddisfare le esigenze dei consumatori e capitalizzando sulle tendenze emergenti, il che alimenta ulteriormente la crescita del mercato.
La densità degli operatori di mercato si riferisce alla distribuzione di aziende o società che operano in un particolare mercato o settore. Indica quanti concorrenti (operatori di mercato) sono presenti in un dato spazio di mercato in relazione alle sue dimensioni o al valore di mercato totale.
Le principali aziende che operano nel mercato del software aziendale G Suite sono:
- SCANALATURA
- MAILTRACK.IO
- Calendulamente
- Società di consulenza NetHunt Inc.
- Mescolare Max
- Salesforce.com Inc.
Disclaimer : le aziende elencate sopra non sono classificate secondo un ordine particolare.
- Ottieni una panoramica dei principali attori del mercato dei software aziendali G Suite
Notizie di mercato e sviluppi recenti del software aziendale G Suite
Il mercato del software aziendale G Suite viene valutato raccogliendo dati qualitativi e quantitativi dopo la ricerca primaria e secondaria, che include importanti pubblicazioni aziendali, dati associativi e database. Di seguito sono elencati alcuni degli sviluppi nel mercato del software aziendale G Suite:
- Google ha rinominato G Suite, un set di strumenti di produttività e collaborazione online per le aziende che include Gmail, Drive, Docs e Meet. Il nuovo nome è Google Workspace, un nome che l'azienda aveva già accennato quando ha introdotto per la prima volta un set di nuovi strumenti di collaborazione e integrazioni di Google Meet per il servizio all'inizio di quest'anno. (Fonte: Google, comunicato stampa, ottobre 2020)
- G Suite di Google ha aggiunto nuovi strumenti di sicurezza e AI. Il gigante della ricerca ha annunciato diversi aggiornamenti a G Suite, il suo set di app che assomigliano a Google Docs e Sheets ma sono su misura per l'ufficio. (Fonte: Tungsram Group, comunicato stampa, luglio 2021)
Copertura e risultati del rapporto sul mercato del software aziendale G Suite
Il rapporto "Dimensioni e previsioni del mercato del software aziendale G Suite (2021-2031)" fornisce un'analisi dettagliata del mercato che copre le seguenti aree:
- Dimensioni e previsioni del mercato del software aziendale G Suite a livello globale, regionale e nazionale per tutti i segmenti di mercato chiave coperti dall'ambito
- Tendenze del mercato del software aziendale G Suite e dinamiche di mercato come driver, vincoli e opportunità chiave
- Analisi dettagliata delle cinque forze PEST/Porter e SWOT
- Analisi di mercato del software aziendale G Suite che copre le principali tendenze del mercato, il quadro globale e regionale, i principali attori, le normative e i recenti sviluppi del mercato
- Analisi del panorama industriale e della concorrenza che copre la concentrazione del mercato, l'analisi della mappa di calore, i principali attori e gli sviluppi recenti per il mercato del software aziendale G Suite
- Profili aziendali dettagliati

Ankita è una dinamica professionista della ricerca di mercato e della consulenza con oltre 8 anni di esperienza nei settori della tecnologia, dei media, dell'ICT, dell'elettronica e dei semiconduttori. Ha guidato e portato a termine con successo oltre 100 incarichi di consulenza e ricerca per clienti globali come Microsoft, Oracle, NEC Corporation, SAP, KPMG ed Expeditors International. Le sue competenze principali includono la valutazione del mercato, l'analisi dei dati, le previsioni, la formulazione di strategie, l'intelligence competitiva e la redazione di report.
Ankita è esperta nella gestione di cicli di progetto completi, dalla progettazione di proposte pre-vendita e discussioni con i clienti fino alla fornitura di insight fruibili post-vendita. È esperta nella gestione di team interfunzionali, nella strutturazione di moduli di ricerca complessi e nell'allineamento delle soluzioni agli obiettivi aziendali specifici del cliente. Le sue eccellenti capacità di comunicazione, leadership e presentazione le hanno permesso di fornire costantemente risultati orientati al valore in contesti di mercato in rapida evoluzione.
- Analisi storica (2 anni), anno base, previsione (7 anni) con CAGR
- Analisi PEST e SWOT
- Valore/volume delle dimensioni del mercato - Globale, Regionale, Nazionale
- Industria e panorama competitivo
- Set di dati Excel
Testimonianze
Il report di mercato sui sistemi SCADA di Insight Partners è completo, con preziosi spunti sulle tendenze attuali e sulle previsioni future. Il team si è dimostrato altamente professionale, reattivo e disponibile in ogni fase del progetto. Siamo molto soddisfatti e consigliamo vivamente i loro servizi.
RAN KEDEM Partner, Reali Technologies LTDsHo richiesto un report su un mercato software molto specifico e il team lo ha prodotto in pochi giorni. Le informazioni erano molto pertinenti e ben presentate. Ho quindi richiesto alcune modifiche e aggiunte al report. Il team è stato ancora una volta molto reattivo e ho ricevuto il report finale in meno di una settimana.
JEAN-HERVE JENN Presidente, Future AnalyticaAbbiamo collaborato con The Insight Partners per un importante studio di mercato e una previsione. Ci hanno fornito informazioni chiare su opportunità e rischi, che ci hanno aiutato a definire i nostri piani. La loro ricerca è stata facile da usare e basata su dati solidi. Ci ha aiutato a prendere decisioni intelligenti e consapevoli. Li consigliamo vivamente.
PIYUSH NAGPAL Vicepresidente senior, Abbaglianti globaliInsight Partners ha fornito ricerche di mercato approfondite e ben strutturate, con una solida competenza nel settore. Il loro team si è dimostrato professionale e reattivo in ogni fase. Il sito web intuitivo ha reso l'accesso ai report di settore semplice e immediato. Li consigliamo vivamente per servizi di ricerca affidabili e di alta qualità.
YUKIHIKO ADACHI Amministratore delegato, Deep Blue, LLC.Questa è la prima volta che acquisto un report di mercato da The Insight Partners. Sebbene inizialmente fossi indeciso, ho visitato il loro sito web e mi sono sentito più a mio agio nell'acquistare un report di mercato. Sono completamente soddisfatto della qualità del report e del servizio clienti. Avevo diverse domande e commenti sul report iniziale, ma dopo un paio di conversazioni via email con il loro analista credo di avere un report che posso utilizzare come input per il nostro processo di pianificazione strategica. Grazie mille per aver dedicato del tempo extra e aver reso questa esperienza positiva. Consiglierò sicuramente il vostro servizio ad altri e sarete la mia prima persona a cui rivolgermi quando avremo bisogno di ulteriori dati di mercato.
GIOVANNI SUZUKI Presidente e Amministratore Delegato, Consigliere di Amministrazione, Tecnologie BKDesidero esprimere la mia gratitudine per il supporto e la professionalità dimostrati nel rispondere alla mia richiesta di informazioni sul mercato dei dispositivi medici in vitro per malattie infettive in Nigeria. Apprezzo la vostra pazienza, la vostra guida e la vostra disponibilità a offrirmi uno sconto, che alla fine ci ha permesso di concludere l'affare. Non vedo l'ora di collaborare con The Insight Partners in futuro, grazie anche all'impressione che mi avete lasciato dopo questo primo incontro.
Dott. Chijioke AMMINISTRATORE DELEGATO DI ONYIA, PineCrest Healthcare Ltd.Motivo dell'acquisto
- Processo decisionale informato
- Comprensione delle dinamiche di mercato
- Analisi competitiva
- Analisi dei clienti
- Previsioni di mercato
- Mitigazione del rischio
- Pianificazione strategica
- Giustificazione degli investimenti
- Identificazione dei mercati emergenti
- Miglioramento delle strategie di marketing
- Aumento dell'efficienza operativa
- Allineamento alle tendenze normative


Sblocca sconti esclusivi sui report
Richiedi ora


 Ottieni un campione gratuito per - Mercato del software aziendale G Suite