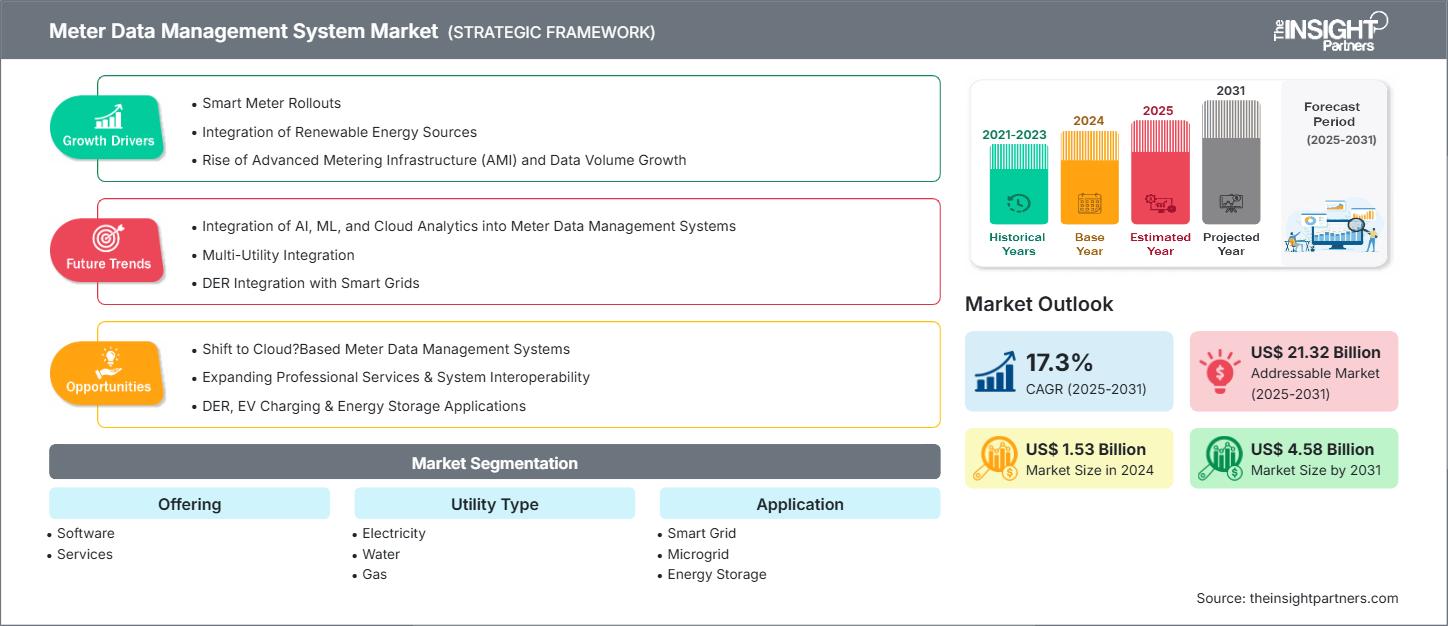
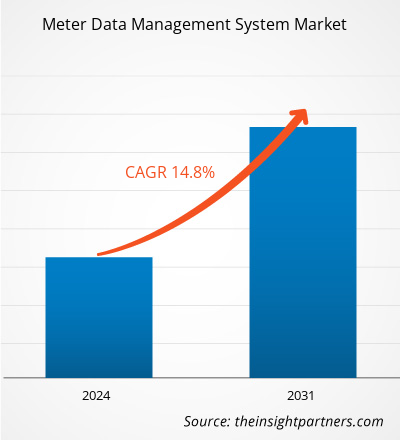
预计到 2031 年,仪表数据管理系统市场规模将从 2024 年的 15.3 亿美元增至 45.8 亿美元。预计 2025-2031 年期间该市场的复合年增长率为 17.3%。
仪表数据管理系统市场分析
全球电表数据管理系统市场增长背后有几个关键因素,例如智能电表的广泛部署、清洁能源的整合、先进计量基础设施 (AMI) 的兴起、数据量的增加以及政府的举措。在向云端电表数据管理解决方案的过渡以及能源可持续性持续投入的推动下,市场在预测期内有望继续增长。影响市场的一个重要趋势是基于人工智能的电表数据管理解决方案的兴起。然而,诸如计量数据波动等问题可能会减缓市场扩张。
仪表数据管理系统市场概况
对于电力、天然气、水利和热力等公用事业企业而言,电表数据管理系统 (MDMS) 依然必不可少。此类系统能够收集、验证和管理来自客户场所的电表数据。所收集的数据是各种活动的基础,包括计费、客户服务、能耗预测、运营监控(例如,停电检测和损耗分析)以及财务报告。此外,除了公用事业行业之外,能源服务公司也使用电表数据管理系统解决方案进行审计和节能项目;能源管理公司使用其进行能耗报告和分析;独立能源生产商和本地能源供应商使用其进行生产规划和工程设计;工商企业则使用其进行内部会计和财务管理。市政当局和政府机构也在公共基础设施项目和法规合规工作中使用这些系统。
您可以免费定制任何报告,包括本报告的部分内容、国家级分析、Excel 数据包,以及为初创企业和大学提供优惠和折扣
仪表数据管理系统市场:

- 获取此报告的顶级关键市场趋势。此免费样品将包括数据分析,从市场趋势到估计和预测。
仪表数据管理系统市场驱动因素和机遇
市场驱动因素:
智能电表的推出:
电表数据管理系统市场背后的主要原因之一是全球范围内大规模部署智能电表,这是各国政府为响应监管需求和基础设施现代化而实施的。可再生能源的整合:
电表数据管理系统平台在当今能源领域正变得越来越不可或缺。本质上,它们就像一个地理信息系统 (GIS) 地图软件,用于捕获、验证、汇总和分析智能计量基础设施 (AMI) 读数的四维(x、y、z 和时间)数据。GIS) mapping software that captures, validates, aggregates, and analyzes four-dimensional (x, y, z and time) data of smart metering infrastructure (AMI) readings.高级计量基础设施(AMI)的兴起和数据量的增长:AMI) and Data Volume Growth:
影响全球计量数据管理系统市场的主要因素之一是先进计量基础设施 (AMI) 的快速部署。AMI).
市场机会:
基于云的部署扩展:
云基础设施的使用日益增多,为公用事业提供了可扩展且更经济实惠的 MDMS 解决方案,这在很大程度上是由基于云的部署需求驱动的。扩展专业服务和系统互操作性:
MDMS 基础设施日益复杂是导致咨询、集成和维护服务需求不断增长的主要原因,尤其侧重于客户信息系统的集成和 DER 的管理。DER、EV充电和储能应用:
微电网、电动汽车充电和储能的出现为专用 MDMS 模块和定制解决方案的开发开辟了新的途径。
仪表数据管理系统市场报告细分分析
为了更清晰地了解电表数据管理系统市场运作方式、增长潜力和最新趋势,我们将市场细分为不同的细分领域。以下是大多数行业报告中使用的标准细分方法:
通过提供:
软件:
电表数据管理系统的软件组件是智能公用事业收集、存储、处理和分析智能电表产生的大量数据的主要核心。服务:
与电表数据管理系统相关的服务涵盖确保其成功部署和生命周期管理所需的各种产品。这些服务包括部署前的活动,例如需求分析、咨询和架构设计,以及随后的系统集成、测试和部署。
按实用程序类型:
电:
电力公司在电表数据管理系统市场占据主导地位,主要是因为智能电表的大规模推广。水:
水表数据管理系统 (MDMS) 的供水部分正在扩展,以允许公用事业公司更新其面临缺水、泄漏和非收入水 (NRW) 等各种问题的旧基础设施。气体:
天然气行业的 MDMS 有助于确保安全、准确计费并满足监管机构的要求。智能燃气表提供系统安全高效运行所需的消耗数据、流量和压力水平。
按应用:
智能电网:
智能电网应用领域是电表数据管理系统的主要和最成熟的用例。微电网:
微电网是独立运行或与主公用电网协同运行的本地化电网。储能:
电表数据管理系统有助于精确跟踪电池充电/放电周期、能量吞吐量、健康状态 (SoH) 和电网信号集成。电动汽车充电:
电动汽车(EV)充电给电网运营商带来了新的挑战和机遇。其他的:
仪表数据管理系统的其他应用正在建筑能源管理、区域供热、点对点能源交易和能源效率计划等领域出现。
按最终用户行业:
- 住宅
- 商业的
- 工业的
每个行业都有特定的仪表数据管理系统要求,这会影响数据管理和分析。
按地域划分:
- 北美
- 欧洲
- 亚太地区
- 南美洲和中美洲
- 中东和非洲
亚太地区的电表数据管理系统市场预计将出现最快的增长。可再生能源的整合和先进计量技术的兴起可能会推动市场的发展。
仪表数据管理系统市场区域洞察
Insight Partners 的分析师已详尽阐述了预测期内影响计量数据管理系统市场的区域趋势和因素。本节还讨论了北美、欧洲、亚太地区、中东和非洲以及南美和中美洲的计量数据管理系统市场细分和地域分布。
仪表数据管理系统市场报告范围
报告属性 | 细节 |
---|---|
2024年的市场规模 | 15.3亿美元 |
2031年的市场规模 | 45.8亿美元 |
全球复合年增长率(2025-2031) | 17.3% |
史料 | 2021-2023 |
预测期 | 2025-2031 |
涵盖的领域 | 通过提供
|
覆盖地区和国家 | 北美
|
市场领导者和主要公司简介 |
|
仪表数据管理系统市场参与者密度:了解其对业务动态的影响
电表数据管理系统市场正在快速增长,这得益于终端用户需求的不断增长,而这些需求的驱动因素包括消费者偏好的不断变化、技术进步以及对产品优势的认知度不断提高。随着需求的增长,企业正在扩展产品线,不断创新以满足消费者需求,并抓住新兴趋势,从而进一步推动市场增长。

- 获取仪表数据管理系统市场顶级关键参与者概览
电表数据管理系统市场份额(按地区)分析
预计未来几年亚太地区市场将增长最快。南美、中美以及中东和非洲等新兴市场也为电表数据管理系统供应商提供了许多尚未开发的扩张机会。
电表数据管理系统市场因地区而异。不同的区域增长模式受到智能电表的实施、可再生能源的使用以及高级计量基础设施 (AMI) 和数据量的增加等因素的影响。以下是不同地区的市场份额和趋势概述:
1. 北美
市场份额:
由于早期采用和公用事业现代化而占据主导地位关键驱动因素:
- 智能电网投资
- 联邦和州级能源效率规定
- 智能电表普及率高
趋势:
将 MDMS 与分布式能源资源管理系统 (DERMS) 集成,实现实时电网平衡
2.欧洲
市场份额:
严格的能源法规和可持续发展目标推动了很大一部分关键驱动因素:
- 欧盟能源效率指令
- 可再生能源整合
- 支持跨境能源数据平台
趋势:
基于云的 MDMS 的增长与欧盟的数字化转型框架保持一致
3. 亚太地区
市场份额:
增长最快的地区,大力推行智能电网举措关键驱动因素:
- 政府主导的数字公用事业计划
- 城市化和智慧城市发展
- 电网可靠性问题
趋势:
支持人工智能的 MDMS 激增,用于管理大量数据和需求预测
4.南美洲和中美洲
市场份额:
新兴市场对公用事业现代化的投资不断增加关键驱动因素:
- 老化基础设施升级
- 偏远地区电气化
- 区域可再生能源项目
趋势:
优先选择模块化MDMS平台,以适应智能电表的逐步普及
5.中东和非洲
市场份额:
政府强力支持,市场不断增长关键驱动因素:
- 国家能源多元化计划
- 水能联结项目
- 智慧城市和公用事业改革
趋势:
在传统能源和可再生能源混合电网中部署MDMS
仪表数据管理系统市场参与者密度:了解其对业务动态的影响
市场密度高,竞争激烈
由于甲骨文、西门子、Itron、兰吉尔和施耐德电气等主要供应商的加入,竞争愈演愈烈。卡姆鲁普(欧洲)、Aclara(北美)和威胜集团(亚洲)等区域性和利基市场参与者也加剧了市场竞争。
这种竞争环境促使供应商通过以下方式实现差异化:
- 与智能电网和可再生能源系统的整合
- 可扩展的云原生 MDMS 平台
- 用于负载预测和故障检测的人工智能驱动数据分析
- 与多供应商电表生态系统的互操作性
机遇与战略举措
- 与公用事业公司和政府合作在全国范围内推广智能电表
- 嵌入 AI/ML 以增强预测性维护和消费分析
在仪表数据管理系统市场运营的主要公司有:
- Itron Inc.——美国
- 甲骨文公司 – 美国
- Gentrack集团——新西兰
- Fluentgrid Limited——印度
- 西门子股份公司——德国
- Landis+Gyr Group AG——瑞士
- 霍尼韦尔国际公司 - 美国
- Hubbell Inc – 美国
- ABB有限公司——瑞士
- AVEVA Group Plc – 英国
免责声明:以上列出的公司没有按照任何特定顺序排列。
研究过程中分析的其他公司:
- 斑杜鹃
- Smartflex
- Connexo 洞察
- ATLAS 能源监控系统
- PI 系统 (AVEVA)
- Net@Suite(信息工程工程师)
- Terranova TAMM MDM
- Ferranti MECOMS
- Energyworx
- 树液
- Meddata 解决方案
- Radix 物联网
- 能源CAP
- 霍尼韦尔EI服务器
- 伊顿
仪表数据管理系统市场新闻和最新发展
- Esyasoft 宣布与 Adani Energy 成立合资企业
Esyasoft 宣布与 Adani Energy Solutions 成立合资企业,在印度及其他国家实施智能计量项目。此次合作涉及 Adani 收购 Esyasoft 智能计量解决方案部门 49% 的股份。 - Landis+Gyr 宣布已完成 MDUS 认证
Landis+Gyr 宣布已完成 Landis+Gyr MDMS 平台的 MDUS 认证。此认证的更新使使用 MDUS 集成服务的公用事业客户能够访问新的间隔和时间序列计费功能。Landis+Gyr 的 MDUS(计量数据统一和同步)是一款独特的解决方案,通过将智能计量环境连接并同步到公用事业后台系统,实现端到端业务流程。
仪表数据管理系统市场报告覆盖范围和交付成果
《仪表数据管理系统市场规模和预测(2021-2031)》报告对以下领域进行了详细的市场分析:
- 仪表数据管理系统市场规模以及全球、区域和国家层面涵盖的所有关键细分市场的预测
- 仪表数据管理系统市场趋势以及市场动态,例如驱动因素、限制因素和关键机遇
- 详细的 PEST 和 SWOT 分析
- 仪表数据管理系统市场分析涵盖主要市场趋势、全球和区域框架、主要参与者、法规和最新市场发展
- 行业格局和竞争分析,涵盖市场集中度、热图分析、知名参与者以及仪表数据管理系统市场的最新发展
- 详细的公司简介
- 历史分析(2 年)、基准年、预测(7 年)及复合年增长率
- PEST 和 SWOT 分析
- 市场规模价值/数量 - 全球、区域、国家
- 行业和竞争格局
- Excel 数据集


- Smart Grid Sensors Market
- Sterilization Services Market
- Procedure Trays Market
- Volumetric Video Market
- Digital Language Learning Market
- Single-Use Negative Pressure Wound Therapy Devices Market
- Aircraft Landing Gear Market
- Artwork Management Software Market
- Arterial Blood Gas Kits Market
- Advanced Planning and Scheduling Software Market

Report Coverage
Revenue forecast, Company Analysis, Industry landscape, Growth factors, and Trends

Segment Covered
This text is related
to segments covered.

Regional Scope
North America, Europe, Asia Pacific, Middle East & Africa, South & Central America

Country Scope
This text is related
to country scope.
常见问题
Key industries utilizing global meter data management systems include:1. Residential: The installation of smart meters in the residential sector has been the most significant worldwide, considered as the key factor for the implementation of metering data management systems.2. Commercial: The energy needs of commercial end users such as malls, office buildings, hospitals, and schools, are unique, and these users are usually the first to take up data-driven energy management solutions.3. Industrial: Heavy industrial facilities with complicated energy systems and high energy consumption should make use of solid and dependable data management systems.
The software segment held a larger share of the global meter data management system market in 2024, as it enabled smart utilities to collect, store, process, and analyze the vast volumes of data generated by smart meters.
As of 2024, the global meter data management system market is valued at approximately US$ 6.96 billion. It is projected to reach US$ 20.25 billion by 2031, registering a CAGR of 17.0% during the forecast period.
Major players include Itron Inc., Oracle Corp, Siemens AG, Landis+Gyr Group AG, and Honeywell International Inc.
Challenges include:Inconsistent Metering Data: Inconsistency in data arises when meter readings deviate from expected or historical consumption patterns, leading to discrepancies that can undermine the accuracy and reliability of energy usage information.
The following factors primarily drive the market growth:Smart Meter Rollouts:One of the main causes behind the meter data management system market is the massive smart meter rollouts all over the planet, which are being implemented by governments as a response to the regulatory demands and their modernization of the infrastructure.Integration of Renewable Energy Sources:Platforms of meter data management system are becoming more and more indispensable in the present energy sector. Essentially, they operate as a geographic information system (GIS) mapping software that captures, validates, aggregates, and analyzes four-dimensional (x, y, z and time) data of smart metering infrastructure (AMI) readings.Rise of Advanced Metering Infrastructure (AMI) and Data Volume Growth:One of the leading factors shaping the world market for meter data management systems is the rapid deployment of advanced metering infrastructure (AMI).
With the integration of AI, utilities can now identify irregularities or anomalies in energy consumption data with far greater speed and accuracy. The speed and accuracy also enable them to automatically flag unusual patterns, reduce the occurrence of billing errors, and mitigate the need for manual intervention or physical inspections, commonly referred to as "truck rolls," which can be costly and time-consuming.
As of 2025:North America is at the forefront of the market, with an estimated share of 31.1%, resulting from extensive smart meter implementation, the revamp of utility infrastructure, and strong regulatory backing for grid digitization.Europe has a 28.4% share of the market, which is contributed by the implementation of the energy efficiency directive, ambitious renewable energy integration targets, and increasing investments in smart grid projects.The Asia Pacific region is the most dynamic market with a forecasted annual growth rate of 18.6% during the period 2025-2031. The rapid expansion can be mainly attributed to large-scale urbanization, government-supported smart grid projects, and increased utilization of cloud-based MDMS platforms.
The List of Companies - Meter Data Management System Market
- Itron Inc.
- Oracle Corp
- Gentrack Group
- Fluentgrid Limited
- Siemens AG
- Landis+Gyr Group AG
- Honeywell International Inc
- Hubbell Inc
- ABB Ltd
- AVEVA Group Plc
The Insight Partners performs research in 4 major stages: Data Collection & Secondary Research, Primary Research, Data Analysis and Data Triangulation & Final Review.
- Data Collection and Secondary Research:
As a market research and consulting firm operating from a decade, we have published and advised several client across the globe. First step for any study will start with an assessment of currently available data and insights from existing reports. Further, historical and current market information is collected from Investor Presentations, Annual Reports, SEC Filings, etc., and other information related to company’s performance and market positioning are gathered from Paid Databases (Factiva, Hoovers, and Reuters) and various other publications available in public domain.
Several associations trade associates, technical forums, institutes, societies and organization are accessed to gain technical as well as market related insights through their publications such as research papers, blogs and press releases related to the studies are referred to get cues about the market. Further, white papers, journals, magazines, and other news articles published in last 3 years are scrutinized and analyzed to understand the current market trends.
- Primary Research:
The primarily interview analysis comprise of data obtained from industry participants interview and answers to survey questions gathered by in-house primary team.
For primary research, interviews are conducted with industry experts/CEOs/Marketing Managers/VPs/Subject Matter Experts from both demand and supply side to get a 360-degree view of the market. The primary team conducts several interviews based on the complexity of the markets to understand the various market trends and dynamics which makes research more credible and precise.
A typical research interview fulfils the following functions:
- Provides first-hand information on the market size, market trends, growth trends, competitive landscape, and outlook
- Validates and strengthens in-house secondary research findings
- Develops the analysis team’s expertise and market understanding
Primary research involves email interactions and telephone interviews for each market, category, segment, and sub-segment across geographies. The participants who typically take part in such a process include, but are not limited to:
- Industry participants: VPs, business development managers, market intelligence managers and national sales managers
- Outside experts: Valuation experts, research analysts and key opinion leaders specializing in the electronics and semiconductor industry.
Below is the breakup of our primary respondents by company, designation, and region:
Once we receive the confirmation from primary research sources or primary respondents, we finalize the base year market estimation and forecast the data as per the macroeconomic and microeconomic factors assessed during data collection.
- Data Analysis:
Once data is validated through both secondary as well as primary respondents, we finalize the market estimations by hypothesis formulation and factor analysis at regional and country level.
- Macro-Economic Factor Analysis:
We analyse macroeconomic indicators such the gross domestic product (GDP), increase in the demand for goods and services across industries, technological advancement, regional economic growth, governmental policies, the influence of COVID-19, PEST analysis, and other aspects. This analysis aids in setting benchmarks for various nations/regions and approximating market splits. Additionally, the general trend of the aforementioned components aid in determining the market's development possibilities.
- Country Level Data:
Various factors that are especially aligned to the country are taken into account to determine the market size for a certain area and country, including the presence of vendors, such as headquarters and offices, the country's GDP, demand patterns, and industry growth. To comprehend the market dynamics for the nation, a number of growth variables, inhibitors, application areas, and current market trends are researched. The aforementioned elements aid in determining the country's overall market's growth potential.
- Company Profile:
The “Table of Contents” is formulated by listing and analyzing more than 25 - 30 companies operating in the market ecosystem across geographies. However, we profile only 10 companies as a standard practice in our syndicate reports. These 10 companies comprise leading, emerging, and regional players. Nonetheless, our analysis is not restricted to the 10 listed companies, we also analyze other companies present in the market to develop a holistic view and understand the prevailing trends. The “Company Profiles” section in the report covers key facts, business description, products & services, financial information, SWOT analysis, and key developments. The financial information presented is extracted from the annual reports and official documents of the publicly listed companies. Upon collecting the information for the sections of respective companies, we verify them via various primary sources and then compile the data in respective company profiles. The company level information helps us in deriving the base number as well as in forecasting the market size.
- Developing Base Number:
Aggregation of sales statistics (2020-2022) and macro-economic factor, and other secondary and primary research insights are utilized to arrive at base number and related market shares for 2022. The data gaps are identified in this step and relevant market data is analyzed, collected from paid primary interviews or databases. On finalizing the base year market size, forecasts are developed on the basis of macro-economic, industry and market growth factors and company level analysis.
- Data Triangulation and Final Review:
The market findings and base year market size calculations are validated from supply as well as demand side. Demand side validations are based on macro-economic factor analysis and benchmarks for respective regions and countries. In case of supply side validations, revenues of major companies are estimated (in case not available) based on industry benchmark, approximate number of employees, product portfolio, and primary interviews revenues are gathered. Further revenue from target product/service segment is assessed to avoid overshooting of market statistics. In case of heavy deviations between supply and demand side values, all thes steps are repeated to achieve synchronization.
We follow an iterative model, wherein we share our research findings with Subject Matter Experts (SME’s) and Key Opinion Leaders (KOLs) until consensus view of the market is not formulated – this model negates any drastic deviation in the opinions of experts. Only validated and universally acceptable research findings are quoted in our reports.
We have important check points that we use to validate our research findings – which we call – data triangulation, where we validate the information, we generate from secondary sources with primary interviews and then we re-validate with our internal data bases and Subject matter experts. This comprehensive model enables us to deliver high quality, reliable data in shortest possible time.