Descripción general del mercado de sistemas de gestión de datos de medidores: crecimiento, tendencias, análisis e informe de investigación (2025-2031)
Datos históricos : 2021-2023 | Año base : 2024 | Período de pronóstico : 2025-2031Tamaño y pronóstico del mercado de sistemas de gestión de datos de medidores (2021-2031), análisis de participación global y regional, tendencias y oportunidades de crecimiento. Cobertura del informe: por oferta (software y servicios), tipo de servicio público (electricidad, agua y gas), aplicación (red inteligente, microrred, almacenamiento de energía, carga de vehículos eléctricos, etc.), usuarios finales (residencial, comercial e industrial) y geografía (Norteamérica, Europa, Asia Pacífico, Oriente Medio y África, Sudamérica y Centroamérica).
- Estado : Publicada
- Código de informe : TIPRE00006169
- Categoría : Tecnología, medios y telecomunicaciones
- Número de páginas : 264
- Formatos de informe disponibles :


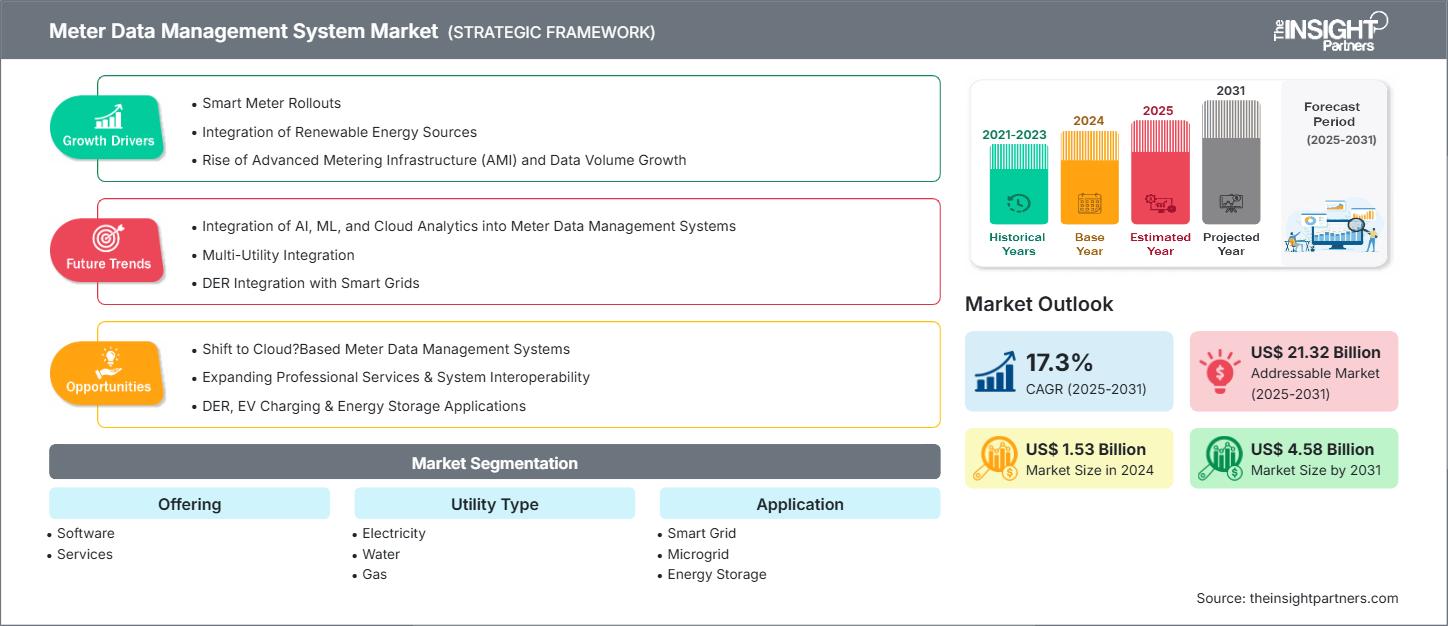
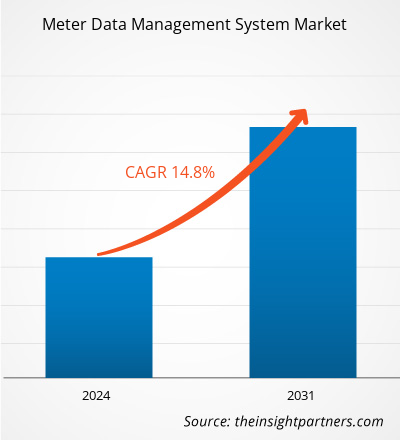
Se espera que el tamaño del mercado de sistemas de gestión de datos de medidores alcance los 4.580 millones de dólares estadounidenses para 2031, desde los 1.530 millones de dólares estadounidenses en 2024. Se anticipa que el mercado registre una CAGR del 17,3 % durante 2025-2031.
Análisis del mercado de sistemas de gestión de datos de medidores
Existen varios factores clave que impulsan el crecimiento del mercado global de sistemas de gestión de datos de medidores, como la amplia implementación de medidores inteligentes, la integración de fuentes de energía limpia, el auge de la infraestructura de medición avanzada ( AMI ), el incremento del volumen de datos y las iniciativas gubernamentales. Es probable que el mercado siga avanzando durante el período de pronóstico, impulsado por la transición a soluciones de gestión de datos de medidores basadas en la nube y el trabajo continuo en sostenibilidad energética. Una tendencia significativa que afecta al mercado es el auge de las soluciones de gestión de datos de medidores basadas en IA. Sin embargo, problemas como la fluctuación de los datos de medición podrían frenar la expansión del mercado.
Descripción general del mercado de sistemas de gestión de datos de medidores
Los sistemas de gestión de datos de contadores ( MDMS ) siguen siendo imprescindibles para las empresas de servicios públicos que trabajan en los sectores de electricidad, gas, agua y energía térmica. Dichos sistemas permiten la recopilación, validación y gestión de datos de contadores que se originan en las instalaciones del cliente. Los datos recopilados son la base de una amplia gama de actividades, incluyendo facturación, servicio al cliente, previsión de consumo, monitorización operativa ( p. ej ., detección de cortes y análisis de pérdidas) e informes financieros. Además, más allá de la industria de servicios públicos, las soluciones de sistemas de gestión de datos de contadores son utilizadas por empresas de servicios energéticos para auditorías y programas de ahorro energético; empresas de gestión energética para informes y análisis de consumo; productores de energía independientes y proveedores de energía locales para la planificación e ingeniería de producción; y empresas comerciales e industriales para la contabilidad interna y la gestión financiera. Los municipios y agencias gubernamentales también utilizan estos sistemas en sus programas de infraestructura pública y esfuerzos de cumplimiento normativo.
Recibirá personalización de cualquier informe, sin cargo, incluidas partes de este informe o análisis a nivel de país, paquete de datos de Excel, así como también grandes ofertas y descuentos para empresas emergentes y universidades.
Mercado de sistemas de gestión de datos de medidores: perspectivas estratégicas
-
Obtenga las principales tendencias clave del mercado de este informe.Esta muestra GRATUITA incluirá análisis de datos, desde tendencias del mercado hasta estimaciones y pronósticos.
Impulsores y oportunidades del mercado de sistemas de gestión de datos de medidores
Factores impulsores del mercado:
-
Implementación de medidores inteligentes :
Una de las principales causas detrás del mercado de sistemas de gestión de datos de medidores son las implementaciones masivas de medidores inteligentes en todo el planeta, que están implementando los gobiernos como respuesta a las demandas regulatorias y su modernización de la infraestructura. -
Integración de fuentes de energía renovables:
Las plataformas de gestión de datos de medidores son cada vez más indispensables en el sector energético actual. En esencia, funcionan como un software cartográfico de sistemas de información geográfica ( SIG ) que captura, valida, agrega y analiza datos cuatridimensionales (x, y, z y tiempo) de las lecturas de la infraestructura de medición inteligente ( AMI ). -
Aumento de la infraestructura de medición avanzada ( AMI ) y crecimiento del volumen de datos:
Uno de los principales factores que configuran el mercado mundial de sistemas de gestión de datos de medición es la rápida implementación de una infraestructura de medición avanzada ( AMI ).
Oportunidades de mercado:
-
Expansión de la implementación basada en la nube:
El uso creciente de la infraestructura en la nube está proporcionando soluciones MDMS escalables y más asequibles para las empresas de servicios públicos, que están impulsadas en gran medida por la necesidad de una implementación basada en la nube. -
Ampliación de los servicios profesionales y la interoperabilidad de sistemas:
La creciente complejidad de las infraestructuras MDMS es la principal razón de la creciente demanda de servicios de consultoría, integración y mantenimiento con un enfoque particular en la integración de sistemas de información de clientes y la gestión de DER. -
Aplicaciones de DER, carga de vehículos eléctricos y almacenamiento de energía:
La llegada de las microrredes, la carga de vehículos eléctricos y el almacenamiento de energía ha abierto nuevas vías para el desarrollo de módulos MDMS especializados y soluciones personalizadas.
Análisis de segmentación del informe de mercado del sistema de gestión de datos de medidores
El mercado de sistemas de gestión de datos de medidores se divide en diferentes segmentos para ofrecer una visión más clara de su funcionamiento, su potencial de crecimiento y las últimas tendencias. A continuación, se presenta el enfoque de segmentación estándar utilizado en la mayoría de los informes del sector:
Ofreciendo:
-
Software:
El componente de software de los sistemas de gestión de datos de medidores es el núcleo principal que permite a las empresas de servicios públicos inteligentes recopilar, almacenar, procesar y analizar los grandes volúmenes de datos generados por los medidores inteligentes. -
Servicios:
Los servicios asociados con los sistemas de gestión de datos de medidores abarcan diversas ofertas necesarias para garantizar su correcta implementación y la gestión de su ciclo de vida. Estas incluyen actividades previas a la implementación, como el análisis de requisitos, la consultoría y el diseño de la arquitectura, seguidas de la integración, las pruebas y la implementación del sistema.
Por tipo de utilidad:
-
Electricidad:
Las empresas de electricidad dominan el mercado de sistemas de gestión de datos de medidores principalmente debido al lanzamiento masivo de medidores eléctricos inteligentes. -
Agua:
La parte del sistema de gestión de datos de medidores (MDMS) de los servicios de agua se está expandiendo para permitir que los servicios públicos actualicen su antigua infraestructura que enfrenta diversos problemas, como escasez de agua, fugas y agua no contabilizada (NRW). -
Gas:
El MDMS en el sector del gas contribuye a la seguridad, la facturación precisa y el cumplimiento de los requisitos de los reguladores. Los medidores de gas inteligentes proporcionan datos de consumo, caudales y niveles de presión necesarios para el funcionamiento seguro y eficiente del sistema.
Por aplicación:
-
Red inteligente:
El segmento de aplicaciones de redes inteligentes es el caso de uso principal y más maduro de los sistemas de gestión de datos de medidores. -
Microrred:
Las microrredes son redes localizadas que funcionan de forma independiente o en conjunto con la red eléctrica principal. -
Almacenamiento de energía:
Los sistemas de gestión de datos de medidores facilitan el seguimiento preciso de los ciclos de carga/descarga de la batería, el rendimiento energético, el estado de salud (SoH) y la integración de la señal de la red. -
Carga de vehículos eléctricos:
La carga de vehículos eléctricos (VE) presenta nuevos desafíos y oportunidades para los operadores de la red. -
Otros:
Están surgiendo otras aplicaciones de los sistemas de gestión de datos de medidores en áreas tales como la gestión de energía en edificios, la calefacción urbana, el comercio de energía entre pares y los programas de eficiencia energética.
Por industria del usuario final:
- Residencial
- Comercial
- Industrial
Cada sector tiene requisitos específicos para el sistema de gestión de datos de contadores. Esto influye en la gestión y el análisis de datos.
Por geografía:
- América del norte
- Europa
- Asia Pacífico
- América del Sur y Central
- Oriente Medio y África
Se prevé que el mercado de sistemas de gestión de datos de medición en Asia Pacífico experimente el mayor crecimiento. La integración de fuentes de energía renovables y el auge de la medición avanzada probablemente impulsarán el mercado.
Perspectivas regionales del mercado de sistemas de gestión de datos de medidores
Los analistas de The Insight Partners han explicado detalladamente las tendencias y los factores regionales que influyen en el mercado de sistemas de gestión de datos de medidores durante el período de pronóstico. Esta sección también analiza los segmentos y la geografía del mercado de sistemas de gestión de datos de medidores en América del Norte, Europa, Asia Pacífico, Oriente Medio y África, y América del Sur y Central.
Alcance del informe de mercado del sistema de gestión de datos de medidores
| Atributo del informe | Detalles |
|---|---|
| Tamaño del mercado en 2024 | 1.530 millones de dólares estadounidenses |
| Tamaño del mercado en 2031 | US$ 4.58 mil millones |
| CAGR global (2025-2031) | 17,3% |
| Datos históricos | 2021-2023 |
| Período de pronóstico | 2025-2031 |
| Segmentos cubiertos |
Ofreciendo
|
| Regiones y países cubiertos |
América del norte
|
| Líderes del mercado y perfiles de empresas clave |
|
Densidad de actores del mercado de sistemas de gestión de datos de medidores: comprensión de su impacto en la dinámica empresarial
El mercado de sistemas de gestión de datos de medidores está creciendo rápidamente, impulsado por la creciente demanda de los usuarios finales debido a factores como la evolución de las preferencias de los consumidores, los avances tecnológicos y un mayor conocimiento de los beneficios del producto. A medida que aumenta la demanda, las empresas amplían su oferta, innovan para satisfacer las necesidades de los consumidores y aprovechan las tendencias emergentes, lo que impulsa aún más el crecimiento del mercado.
- Obtenga una descripción general de los principales actores clave del mercado del sistema de gestión de datos de medidores
Análisis de la cuota de mercado del sistema de gestión de datos de medidores por geografía
Se prevé que el mercado de Asia Pacífico experimente el mayor crecimiento en los próximos años. Los mercados emergentes de Sudamérica, Centroamérica, Oriente Medio y África también ofrecen numerosas oportunidades sin explotar para la expansión de los proveedores de sistemas de gestión de datos de medidores.
El mercado de sistemas de gestión de datos de medidores varía según la región. Los diferentes patrones de crecimiento regional se ven influenciados por factores como la implementación de medidores inteligentes, el uso de energías renovables y el aumento de la infraestructura de medición avanzada (AMI) y el volumen de datos. A continuación, se presenta un resumen de la cuota de mercado y la tendencia en las diferentes regiones:
1. América del Norte
-
Cuota de mercado:
Posee una participación dominante debido a la adopción temprana y la modernización de los servicios públicos. -
Factores clave:
- Inversiones en redes inteligentes
- Mandatos de eficiencia energética a nivel federal y estatal
- Alta penetración de medidores inteligentes
-
Tendencias:
Integración de MDMS con sistemas de gestión de recursos energéticos distribuidos (DERMS) para equilibrar la red en tiempo real
2. Europa
-
Cuota de mercado:
Participación significativa impulsada por estrictas regulaciones energéticas y objetivos de sostenibilidad -
Factores clave:
- Directivas de la UE sobre eficiencia energética
- Integración de energías renovables
- Apoyo a las plataformas de datos energéticos transfronterizos
-
Tendencias:
Crecimiento del MDMS basado en la nube alineado con los marcos de transformación digital de la UE
3. Asia Pacífico
-
Cuota de mercado:
La región de más rápido crecimiento con importantes iniciativas de implementación de redes inteligentes -
Factores clave:
- Programas de servicios públicos digitales dirigidos por el gobierno
- Urbanización y desarrollos de ciudades inteligentes
- Preocupaciones sobre la confiabilidad de la red
-
Tendencias:
Aumento de los MDMS habilitados con IA para gestionar un gran volumen de datos y la previsión de la demanda
4. América del Sur y Central
-
Cuota de mercado:
Mercado emergente con crecientes inversiones en modernización de servicios públicos -
Factores clave:
- Actualizaciones de infraestructura obsoleta
- Electrificación en zonas remotas
- Proyectos regionales de energías renovables
-
Tendencias:
Preferencia por plataformas MDMS modulares para dar cabida a la adopción gradual de medidores inteligentes
5. Oriente Medio y África
-
Cuota de mercado:
Mercado en crecimiento con fuerte respaldo gubernamental -
Factores clave:
- Planes nacionales de diversificación energética
- Proyectos de nexo agua-energía
- Reformas de servicios públicos y ciudades inteligentes
-
Tendencias:
Implementación de MDMS en redes híbridas que combinan fuentes de energía tradicionales y renovables
Densidad de actores del mercado de sistemas de gestión de datos de medidores: comprensión de su impacto en la dinámica empresarial
Alta densidad de mercado y competencia
La competencia se intensifica debido a la presencia de grandes proveedores como Oracle, Siemens, Itron, Landis+Gyr y Schneider Electric. Actores regionales y de nicho como Kamstrup (Europa), Aclara (Norteamérica) y Wasion Group (Asia) también contribuyen a la saturación del mercado.
Este entorno competitivo impulsa a los proveedores a diferenciarse mediante:
- Integración con redes inteligentes y sistemas de energía renovable
- Plataformas MDMS escalables y nativas de la nube
- Análisis de datos impulsado por IA para la previsión de carga y la detección de fallas
- Interoperabilidad con ecosistemas de medidores de múltiples proveedores
Oportunidades y movimientos estratégicos
- Colaboraciones con empresas de servicios públicos y gobiernos para la implementación de medidores inteligentes en todo el país
- Incorporación de IA/ML para mejorar el mantenimiento predictivo y el análisis del consumo
Las principales empresas que operan en el mercado de sistemas de gestión de datos de medidores son:
- Itron Inc. – EE. UU.
- Oracle Corp – EE. UU.
- Grupo Gentrack – Nueva Zelanda
- Fluentgrid Limited – India
- Siemens AG – Alemania
- Landis+Gyr Group AG – Suiza
- Honeywell International Inc – EE. UU.
- Hubbell Inc. – EE. UU.
- ABB Ltd – Suiza
- AVEVA Group Plc – Reino Unido
Descargo de responsabilidad: Las empresas enumeradas anteriormente no están clasificadas en ningún orden particular.
Otras empresas analizadas durante el curso de la investigación:
- Cuculus ZONOS
- Smartflex
- Perspectiva de Connexo
- Sistema de Monitoreo de Energía ATLAS
- El sistema PI (AVEVA)
- Net@Suite (Ingeniería Informática)
- Terranova TAMM MDM
- Ferranti MECOMS
- Energyworx
- SAVIA
- Solución Medidata
- Radix IoT
- EnergyCAP
- Servidor EI de Honeywell
- Eaton
Noticias y desarrollos recientes del mercado de sistemas de gestión de datos de medidores
-
Esyasoft anunció la formación de una empresa conjunta con Adani Energy
Solutions para implementar proyectos de medición inteligente en India y otros países. Esta alianza implica la adquisición por parte de Adani del 49 % de la división de soluciones de medición inteligente de Esyasoft. -
Landis+Gyr anunció la finalización de la certificación MDUS
para su plataforma MDMS. La renovación de esta certificación permite a los clientes de servicios públicos que utilizan los servicios de integración MDUS acceder a nuevas funciones de facturación por intervalos y series temporales. MDUS (Unificación y Sincronización de Datos de Medición) de Landis+Gyr es una solución única que facilita la integración de procesos empresariales mediante la conexión y sincronización de sistemas de medición inteligente con los sistemas administrativos de la empresa.
Informe de mercado sobre sistemas de gestión de datos de medidores: cobertura y resultados
El informe "Tamaño y pronóstico del mercado de sistemas de gestión de datos de medidores (2021-2031)" ofrece un análisis detallado del mercado que abarca las siguientes áreas:
- Tamaño del mercado del sistema de gestión de datos de medidores y pronóstico a nivel global, regional y nacional para todos los segmentos clave del mercado cubiertos bajo el alcance
- Tendencias del mercado de sistemas de gestión de datos de medidores, así como dinámicas del mercado como impulsores, restricciones y oportunidades clave
- Análisis PEST y FODA detallado
- Análisis del mercado de sistemas de gestión de datos de medidores que abarca las tendencias clave del mercado, el marco global y regional, los principales actores, las regulaciones y los desarrollos recientes del mercado.
- Análisis del panorama de la industria y la competencia que abarca la concentración del mercado, el análisis de mapas de calor, los actores destacados y los desarrollos recientes para el mercado de sistemas de gestión de datos de medidores.
- Perfiles detallados de empresas

Ankita es una profesional dinámica en investigación de mercados y consultoría con más de 8 años de experiencia en los sectores de tecnología, medios de comunicación, TIC, electrónica y semiconductores. Ha liderado y ejecutado con éxito más de 100 proyectos de consultoría e investigación para clientes globales como Microsoft, Oracle, NEC Corporation, SAP, KPMG y Expeditors International. Sus principales competencias incluyen la evaluación de mercado, el análisis de datos, la previsión, la formulación de estrategias, la inteligencia competitiva y la redacción de informes.
Ankita es experta en la gestión de ciclos completos de proyecto, desde el diseño de propuestas de preventa y las conversaciones con los clientes hasta la entrega de información práctica posventa. Es experta en la gestión de equipos multifuncionales, la estructuración de módulos de investigación complejos y la alineación de soluciones con los objetivos de negocio específicos del cliente. Sus excelentes habilidades de comunicación, liderazgo y presentación le han permitido obtener constantemente resultados orientados al valor en entornos de mercado dinámicos y en constante evolución.
- Análisis histórico (2 años), año base, pronóstico (7 años) con CAGR
- Análisis PEST y FODA
- Tamaño del mercado, valor/volumen: global, regional y nacional
- Industria y panorama competitivo
- Conjunto de datos de Excel
Testimonios
El informe de mercado de sistemas SCADA de Insight Partners es completo y ofrece información valiosa sobre las tendencias actuales y las previsiones futuras. El equipo fue altamente profesional, receptivo y me brindó un gran apoyo en todo momento. Estamos muy satisfechos y recomendamos ampliamente sus servicios.
RAN KEDEM Socio, Reali Technologies LTDsSolicité un informe sobre un mercado de software muy específico y el equipo lo elaboró en pocos días. La información era muy relevante y estaba bien presentada. Posteriormente, solicité algunos cambios y adiciones al informe. El equipo fue muy receptivo y recibí el informe final en menos de una semana.
JEAN-HERVE JENN Presidente, Future AnalyticaTrabajamos con The Insight Partners para un importante estudio y pronóstico de mercado. Nos brindaron una visión clara de las oportunidades y los riesgos, lo que nos ayudó a definir nuestros planes. Su investigación fue fácil de usar y se basó en datos sólidos. Nos ayudó a tomar decisiones inteligentes y seguras. Los recomendamos ampliamente.
PIYUSH NAGPAL Vicepresidente Sénior, , High Beam GlobalThe Insight Partners realizó una investigación de mercado profunda y bien estructurada con una sólida experiencia en el sector. Su equipo fue profesional y receptivo en todo momento. El sitio web, fácil de usar, facilitó el acceso a los informes del sector. Los recomendamos ampliamente por sus servicios de investigación confiables y de alta calidad.
YUKIHIKO ADACHI Director Ejecutivo, , Deep Blue, LLCEsta es la primera vez que compro un informe de mercado de The Insight Partners. Aunque al principio tenía dudas, visité su sitio web y me sentí más cómodo al arriesgarme y comprarlo. Estoy completamente satisfecho con la calidad del informe y el servicio al cliente. Tenía varias preguntas y comentarios sobre el informe inicial, pero después de un par de conversaciones por correo electrónico con su analista, creo que tengo un informe que puedo usar como base para nuestro proceso de planificación estratégica. Muchas gracias por tomarse el tiempo y hacer de esta una experiencia positiva. Sin duda, recomendaré sus servicios y serán mi primera opción cuando necesitemos más datos de mercado.
JOHN SUZUKI Presidente y Director Ejecutivo, Director de la Junta Directiva, BK TechnologiesAgradezco su apoyo y la profesionalidad que demostraron al atender mi solicitud de información sobre el mercado de diagnóstico in vitro (IVD) para enfermedades infecciosas en Nigeria. Agradezco su paciencia, su orientación y su disposición a ofrecerme un descuento, lo que finalmente nos permitió cerrar un trato. Espero poder colaborar con The Insight Partners en el futuro, gracias a la impresión que me causó este primer encuentro.
DRA. CHIJIOKE ONYIA, DIRECTORA GENERAL, PineCrest Healthcare Ltd.Razón para comprar
- Toma de decisiones informada
- Comprensión de la dinámica del mercado
- Análisis competitivo
- Información sobre clientes
- Pronósticos del mercado
- Mitigación de riesgos
- Planificación estratégica
- Justificación de la inversión
- Identificación de mercados emergentes
- Mejora de las estrategias de marketing
- Impulso de la eficiencia operativa
- Alineación con las tendencias regulatorias


Desbloquea descuentos exclusivos en informes
Consultar ahora


 Obtenga una muestra gratuita para - Mercado de sistemas de gestión de datos de medidores