نمو سوق برمجيات تقديم الطعام، الحجم، المشاركة، الاتجاهات، تحليل اللاعبين الرئيسيين، والتوقعات حتى عام 2027
البيانات التاريخية : 2018-2019 | سنة الأساس : 2020 | فترة التنبؤ : 2021-2027توقعات سوق برامج تقديم الطعام حتى عام 2027 - تأثير كوفيد-19 والتحليل العالمي حسب النشر (السحابي والمحلي) والمستخدم النهائي (شركات تقديم الطعام، والمطاعم والفنادق، وغيرها)
- تاريخ التقرير : Jan 2021
- رمز التقرير : TIPRE00012438
- الفئة : التكنولوجيا والإعلام والاتصالات
- الحالة : نُشرت
- تنسيقات التقارير المتاحة :


- عدد الصفحات : 139
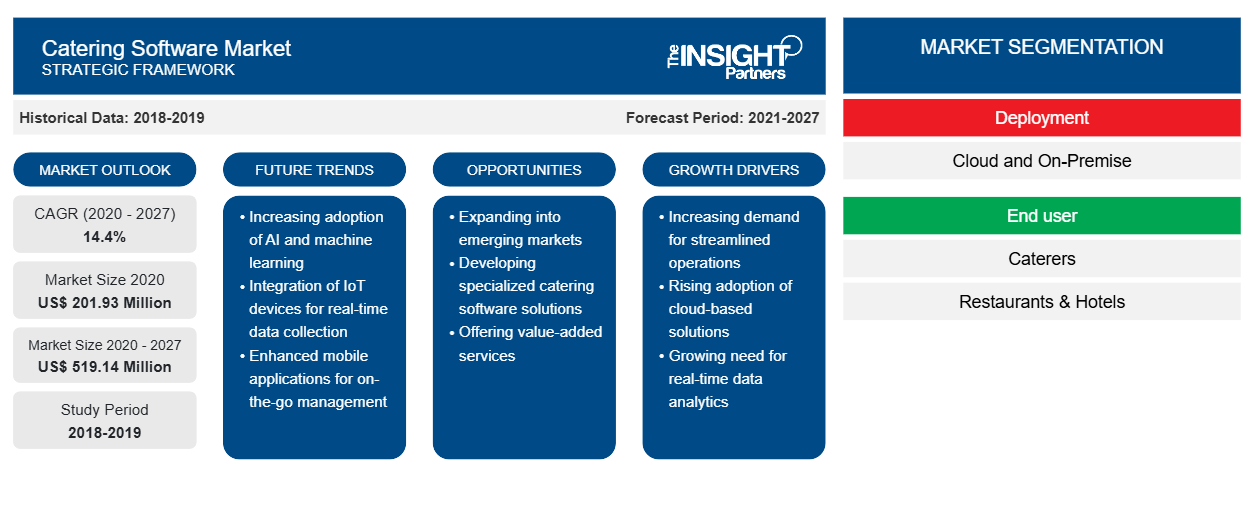
من المتوقع أن ينمو سوق برمجيات تقديم الطعام من 201.93 مليون دولار أمريكي في عام 2020 إلى 519.14 مليون دولار أمريكي بحلول عام 2027؛ ومن المتوقع أن ينمو بمعدل نمو سنوي مركب قدره 14.4٪ من عام 2020 إلى عام 2027.
إن استخدام تقنية تحليل البيانات الضخمة لتحسين عمليات تقديم الطعام يعزى إلى نمو السوق. تتمتع تقنية تحليل البيانات الضخمة بإمكانات هائلة لتحويل أعمال تقديم الطعام بالكامل. يساعد تبني حلول البيانات الضخمة في تحسين كفاءة شبكات التوزيع والإنتاج في صناعة تقديم الطعام بشكل عام. تسمح التكنولوجيا بتتبع العملية الكاملة لنقل الإمدادات. من خلال الرؤى في الوقت الفعلي، يمكن للعملاء تتبع أوامر الشراء الخاصة بهم على أجهزتهم والتحقق من حالة تقديم الطعام. يساعد دمج لوحة معلومات التحليلات في برنامج تقديم الطعام في تتبع وتقييم أداء وكلاء تقديم الطعام. أيضًا، يجب أن يكون لدى كل صاحب مصلحة في أعمال تقديم الطعام بيانات ذات صلة بمنتجاتهم، بما في ذلك البيانات المتعلقة بالمزارعين والشاحنين وتجار التجزئة، وانتهاءً بالمطاعم والمتاجر. على سبيل المثال، يستخدم مطعم كنتاكي أدوات البيانات الضخمة لتحليل ردود الفعل من العملاء وتفضيلات الطعام، مما يؤدي إلى تجارب أفضل للعملاء والمبيعات والأرباح.
لقد شهدت صناعة التجارة الإلكترونية في جميع المناطق تحولات عديدة خلال السنوات القليلة الماضية؛ وقد دفع نمو الصناعة اللاعبين في سوق برامج تقديم الطعام إلى الاستفادة من تحليلات البيانات الضخمة لاتخاذ قرارات عمل أكثر ذكاءً. تسمح التكنولوجيا لتجار التجزئة عبر الإنترنت بتقييم تفاعلات العملاء عبر القنوات مثل الأجهزة المحمولة ووسائل التواصل الاجتماعي ومواقع الويب.
قم بتخصيص هذا التقرير ليناسب متطلباتك
ستحصل على تخصيص لأي تقرير - مجانًا - بما في ذلك أجزاء من هذا التقرير، أو تحليل على مستوى الدولة، وحزمة بيانات Excel، بالإضافة إلى الاستفادة من العروض والخصومات الرائعة للشركات الناشئة والجامعات
سوق برمجيات تقديم الطعام: رؤى استراتيجية
- احصل على أهم اتجاهات السوق الرئيسية لهذا التقرير.ستتضمن هذه العينة المجانية تحليلاً للبيانات، بدءًا من اتجاهات السوق وحتى التقديرات والتوقعات.
تأثير جائحة كوفيد-19 على سوق برامج تقديم الطعام
في أعقاب تفشي جائحة كوفيد-19 على مستوى العالم، اضطرت بعض الشركات إلى تقليص عملياتها بسبب تدابير الاحتواء المختلفة التي أصدرتها الحكومات في جميع أنحاء العالم. دفع الانتشار السريع للفيروس الحكومات في جميع أنحاء العالم إلى فرض قيود صارمة على حركة الأشخاص والمركبات. لقد تضررت الشركات التي تعتمد على التفاعل المادي لتوليد الإيرادات بشدة بسبب عمليات الإغلاق. ونتيجة لذلك، تركز بعض الشركات على زيادة التحويلات والتفاعلات والإيرادات من خلال الوسائط الرقمية.lockdowns. As a result, some businesses are concentrating on increasing conversions, interactions, and revenue through digital media.
رؤى السوق - سوق برامج تقديم الطعام
التعلم الآلي سيحدث ثورة في مجال تقديم الطعام
في صناعة المطاعم، يؤدي عدم كفاية رسم الخرائط للمناطق، وعدم التوازن بين الطلب وتوافر الموارد إلى العديد من التحديات. يشكل التعلم الآلي والذكاء الاصطناعي أسس تقنيات تقديم الطعام من الجيل التالي. تمكن هذه التقنيات الأنظمة من التعلم من البيانات المسجلة، والتي تتألف من خوارزميات وأنماط ورؤى تنبؤية. تتبنى العديد من شركات توصيل الطعام عبر الإنترنت تقنية التعلم الآلي لتعزيز أعمال تقديم الطعام وزيادة كفاءة أعمالها. على سبيل المثال، تستثمر Deliveroo، وهي شركة توصيل طعام مقرها المملكة المتحدة، في تقنيات متقدمة مثل التعلم الآلي لتظل قادرة على المنافسة في السوق من خلال تقديم خدمة توصيل طعام أكثر فعالية. تستخدم Glovo، وهي شركة توصيل طعام مقرها إسبانيا، أيضًا التعلم الآلي للتنبؤ باحتمالية البقاء نشطًا على التطبيق. وبالتالي، من المتوقع أن يؤدي دمج التعلم الآلي في شركات تقديم الطعام إلى تعزيز الطلب على برامج تقديم الطعام خلال فترة التنبؤ.
رؤى تعتمد على النشر
بناءً على نوع النشر، يتم تقسيم سوق برامج تقديم الطعام إلى السحابة والمحلية. احتلت شريحة السحابة أكبر حصة في السوق في عام 2019.
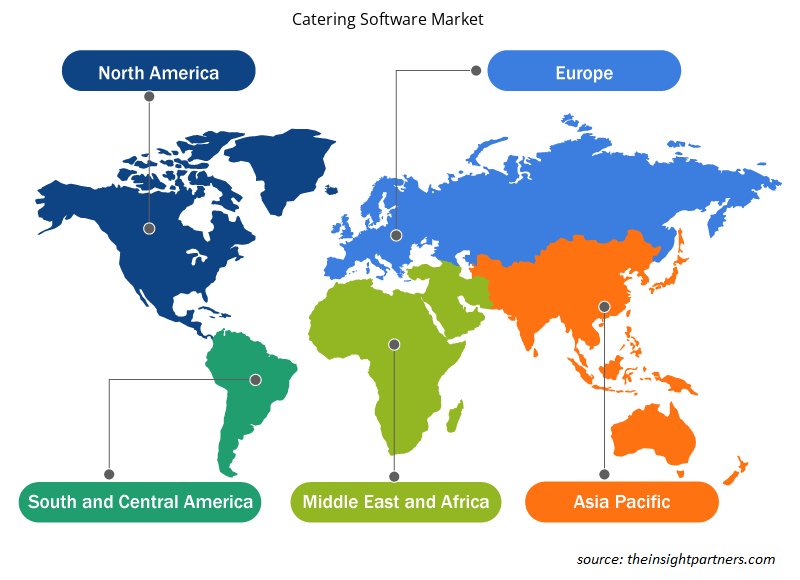
رؤى إقليمية حول سوق برامج تقديم الطعام
لقد قام المحللون في Insight Partners بشرح الاتجاهات والعوامل الإقليمية المؤثرة على سوق برمجيات تقديم الطعام طوال فترة التوقعات بشكل شامل. يناقش هذا القسم أيضًا قطاعات سوق برمجيات تقديم الطعام والجغرافيا في جميع أنحاء أمريكا الشمالية وأوروبا ومنطقة آسيا والمحيط الهادئ والشرق الأوسط وأفريقيا وأمريكا الجنوبية والوسطى.
- احصل على البيانات الإقليمية المحددة لسوق برامج تقديم الطعام
نطاق تقرير سوق برامج تقديم الطعام
| سمة التقرير | تفاصيل |
|---|---|
| حجم السوق في عام 2020 | 201.93 مليون دولار أمريكي |
| حجم السوق بحلول عام 2027 | 519.14 مليون دولار أمريكي |
| معدل النمو السنوي المركب العالمي (2020 - 2027) | 14.4% |
| البيانات التاريخية | 2018-2019 |
| فترة التنبؤ | 2021-2027 |
| القطاعات المغطاة | حسب النشر
|
| المناطق والدول المغطاة | أمريكا الشمالية
|
| قادة السوق وملفات تعريف الشركات الرئيسية |
|
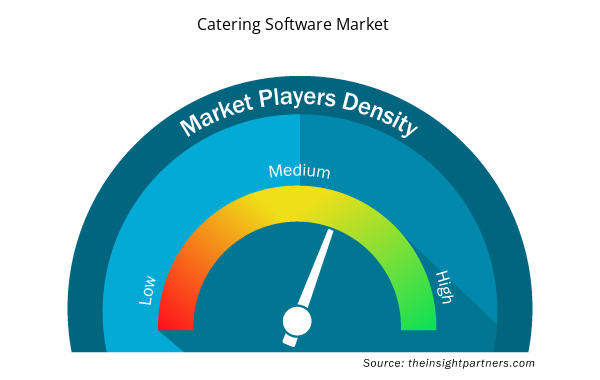
كثافة اللاعبين في سوق برمجيات تقديم الطعام: فهم تأثيرها على ديناميكيات الأعمال
يشهد سوق برامج تقديم الطعام نموًا سريعًا، مدفوعًا بالطلب المتزايد من المستخدم النهائي بسبب عوامل مثل تفضيلات المستهلكين المتطورة والتقدم التكنولوجي والوعي المتزايد بفوائد المنتج. ومع ارتفاع الطلب، تعمل الشركات على توسيع عروضها والابتكار لتلبية احتياجات المستهلكين والاستفادة من الاتجاهات الناشئة، مما يؤدي إلى زيادة نمو السوق.
تشير كثافة اللاعبين في السوق إلى توزيع الشركات أو المؤسسات العاملة في سوق أو صناعة معينة. وهي تشير إلى عدد المنافسين (اللاعبين في السوق) الموجودين في مساحة سوق معينة نسبة إلى حجمها أو قيمتها السوقية الإجمالية.
الشركات الرئيسية العاملة في سوق برمجيات تقديم الطعام هي:
- شركة ابتيوس سيستمز المحدودة
- شركة بيتر كاتير
- برنامج كاتيريز
- شركة كاتر تراكس
- CaterZen من شركة Restaurant & Catering Systems
إخلاء المسؤولية : الشركات المذكورة أعلاه ليست مرتبة بأي ترتيب معين.
- احصل على نظرة عامة على أهم اللاعبين الرئيسيين في سوق برمجيات تقديم الطعام
يركز اللاعبون العاملون في سوق برمجيات تقديم الطعام بشكل أساسي على تطوير المنتجات المتقدمة والفعالة.
- في عام 2020، استثمرت CaterZen ساعات برمجة منذ بداية شهر مارس لتأكيد قدرة المطاعم ومقدمي الطعام على مواصلة العمليات من خلال التركيز القوي على الطلب عبر الإنترنت وتوصيل الطعام.
- في عام 2020، قدمت شركة Flex Catering نظام KDS (نظام عرض المطبخ) وهو نوع من الشاشات الرقمية التي تحل محل طلبات التذاكر المطبوعة أو المكتوبة بخط اليد في المطاعم ومؤسسات الأغذية.
تم تقسيم سوق برمجيات تقديم الطعام على النحو التالي:
برنامج تقديم الطعام العالمي - حسب النشر
- سحاب
- في الموقع
برنامج تقديم الطعام العالمي - حسب المستخدم النهائي
- المطاعم
- المطاعم والفنادق
- آحرون
السوق العالمية لبرمجيات المطاعم – حسب المنطقة الجغرافية
أمريكا الشمالية
- نحن
- كندا
- المكسيك
أوروبا
- فرنسا
- ألمانيا
- إيطاليا
- روسيا
- المملكة المتحدة
- بقية أوروبا
آسيا والمحيط الهادئ (APAC)
- اليابان
- الصين
- أستراليا
- الهند
- كوريا الجنوبية
- بقية منطقة آسيا والمحيط الهادئ
الشرق الأوسط وأفريقيا
- المملكة العربية السعودية
- الامارات العربية المتحدة
- جنوب أفريقيا
- باقي منطقة الشرق الأوسط وأفريقيا
أمريكا الجنوبية (SAM)
- البرازيل
- الأرجنتين
- بقية سام
سوق برمجيات المطاعم – نبذة عن الشركة
- شركة ابتيوس سيستمز المحدودة
- شركة بيتر كاتير
- برنامج كاتيريز
- شركة كاتر تراكس
- CaterZen من شركة Restaurant & Catering Systems
- خدمات تقديم الطعام المرنة
- برنامج FoodStorm Catering (CaterXpress)
- دفتر التخطيط (دفتر عمل الزفاف الخاص بي، ذ.م.م)
- شركة أنظمة الربح المحدودة
- بيكسيير

أنكيتا خبيرة ديناميكية في أبحاث السوق والاستشارات، تتمتع بخبرة تزيد عن 8 سنوات في قطاعات التكنولوجيا والإعلام وتكنولوجيا المعلومات والاتصالات والإلكترونيات وأشباه الموصلات. وقد قادت ونفذت بنجاح أكثر من 100 مهمة استشارية وبحثية لعملاء عالميين مثل مايكروسوفت وأوراكل وشركة NEC وSAP وKPMG وExpeditors International. تشمل كفاءاتها الأساسية تقييم السوق، وتحليل البيانات، والتنبؤ، وصياغة الاستراتيجيات، والاستخبارات التنافسية، وكتابة التقارير.
أنكيتا بارعة في إدارة دورات المشاريع الكاملة، بدءًا من تصميم عروض ما قبل البيع ومناقشات العملاء، وصولًا إلى تقديم رؤى عملية بعد البيع. كما أنها ماهرة في إدارة فرق متعددة الوظائف، وهيكلة وحدات بحثية معقدة، ومواءمة الحلول مع أهداف العمل الخاصة بالعملاء. وقد مكنتها مهاراتها الممتازة في التواصل والقيادة والعرض التقديمي من تحقيق نتائج قيّمة باستمرار في بيئات سوقية سريعة التطور.
- التحليل التاريخي (سنتان)، سنة الأساس، التوقعات (7 سنوات) مع معدل النمو السنوي المركب
- تحليل PEST و SWOT
- حجم السوق والقيمة / الحجم - عالمي، إقليمي، بلد
- الصناعة والمنافسة
- مجموعة بيانات إكسل
التقارير الحديثة
تقارير ذات صلة
شهادات العملاء
تقرير سوق أنظمة SCADA من Insight Partners شامل، ويقدم رؤى قيّمة حول الاتجاهات الحالية والتوقعات المستقبلية. تميّز الفريق باحترافية عالية وسرعة في الاستجابة ودعم مستمر طوال الوقت. نحن راضون جدًا ونوصي بشدة بخدماتهم.
ران كيديم شريك, شركة ريالي تكنولوجيز المحدودةطلبتُ تقريرًا عن سوق برمجيات محدد، وأعدّه الفريق في غضون أيام قليلة. كانت المعلومات ذات صلة وثيقة وعرضها جيد. ثم طلبتُ بعض التعديلات والإضافات على التقرير. وكان الفريق متجاوبًا للغاية، وحصلتُ على التقرير النهائي في أقل من أسبوع.
جان هيرفيه جين رئيس مجلس الإدارة, فيوتشر أناليتيكاعملنا مع شركة "إنسايت بارتنرز" لإجراء دراسة سوقية وتوقعات مهمة. زودونا برؤى واضحة حول الفرص والمخاطر، مما ساعدنا في صياغة خططنا. كانت أبحاثهم سهلة الاستخدام ومبنية على بيانات دقيقة، مما ساعدنا على اتخاذ قرارات ذكية وواثقة. نوصي بهم بشدة.
بيوش ناجبال نائب الرئيس الأول, شعاع عالي عالميقدّمت شركة Insight Partners أبحاثًا سوقية ثاقبة ومنظمة جيدًا بخبرة واسعة في هذا المجال. تميّز فريقهم بالاحترافية وسرعة الاستجابة طوال الوقت. وسهّل موقعهم الإلكتروني سهل الاستخدام الوصول إلى تقارير القطاع. نوصي بهم بشدة لخدمات بحثية موثوقة وعالية الجودة.
يوكيهيكو أداتشي المدير التنفيذي, ديب بلو، ذ.م.م.هذه أول مرة أشتري فيها تقرير سوق من The Insight Partners. رغم أنني كنت مترددًا في البداية، إلا أنني زرت موقعهم الإلكتروني وشعرت براحة أكبر للمخاطرة وشراء تقرير السوق. أنا راضٍ تمامًا عن جودة التقرير وخدمة العملاء. كانت لديّ عدة أسئلة وتعليقات حول التقرير الأولي، ولكن بعد بضع محادثات عبر البريد الإلكتروني مع محللهم، أعتقد أن لديّ تقريرًا يمكنني استخدامه كمدخل لعملية التخطيط الاستراتيجي لدينا. شكرًا جزيلاً لكم على تخصيص وقتكم الإضافي وجعل هذه التجربة إيجابية. سأوصي بخدماتكم للآخرين بالتأكيد، وستكونون أول من ألجأ إليه عندما نحتاج إلى المزيد من بيانات السوق.
جون سوزوكي الرئيس والرئيس التنفيذي وعضو مجلس الإدارة, بي كيه تكنولوجيزأود أن أقدّر دعمكم واحترافيتكم في الاستجابة لطلبي للحصول على معلومات بشأن سوق التشخيص المخبري للأمراض المعدية في نيجيريا. كما أُقدّر صبركم وتوجيهكم، واستعدادكم لتقديم خصم، مما مكّننا في النهاية من إتمام الصفقة. أتطلع إلى التعامل مع "ذا إنسايت بارتنرز" مستقبلًا، كل ذلك بفضل الانطباع الذي تركتموه لديّ نتيجةً لهذا اللقاء الأول.
الدكتور تشيجيوك أونيا المدير الإداري, شركة باينكريست للرعاية الصحية المحدودةسبب الشراء
- اتخاذ قرارات مدروسة
- فهم ديناميكيات السوق
- تحليل المنافسة
- رؤى العملاء
- توقعات السوق
- تخفيف المخاطر
- التخطيط الاستراتيجي
- مبررات الاستثمار
- تحديد الأسواق الناشئة
- تحسين استراتيجيات التسويق
- تعزيز الكفاءة التشغيلية
- مواكبة التوجهات التنظيمية


 احصل على عينة مجانية ل - سوق برامج تقديم الطعام