نمو سوق تحليلات عمليات تكنولوجيا المعلومات، حجمه، حصته السوقية، اتجاهاته، تحليلات اللاعبين الرئيسيين، والتوقعات حتى عام 2031
البيانات التاريخية : | سنة الأساس : | فترة التنبؤ :حجم سوق تحليلات عمليات تكنولوجيا المعلومات وتوقعاته (2021-2031)، والحصة العالمية والإقليمية، والاتجاهات، وفرص النمو. يغطي التقرير: حسب العرض (البرمجيات والخدمات)، والنشر (محليًا، وسحابيًا، وهجينًا)، والتطبيقات [إدارة أداء التطبيقات (APM)، وتحليل السبب الجذري، وإدارة الشبكات والأمن، وغيرها)]، والقطاعات الرئيسية (الخدمات المصرفية والمالية والتأمين، وتكنولوجيا المعلومات والاتصالات، وتجارة التجزئة والتجارة الإلكترونية، والرعاية الصحية، والتصنيع، وغيرها)، والمنطقة (أمريكا الشمالية، وأوروبا، وآسيا والمحيط الهادئ، والشرق الأوسط وأفريقيا، وأمريكا الجنوبية والوسطى).
- تاريخ التقرير : Aug 2025
- رمز التقرير : TIPRE00011205
- الفئة : التكنولوجيا والإعلام والاتصالات
- الحالة : نُشرت
- تنسيقات التقارير المتاحة :


- عدد الصفحات : 275
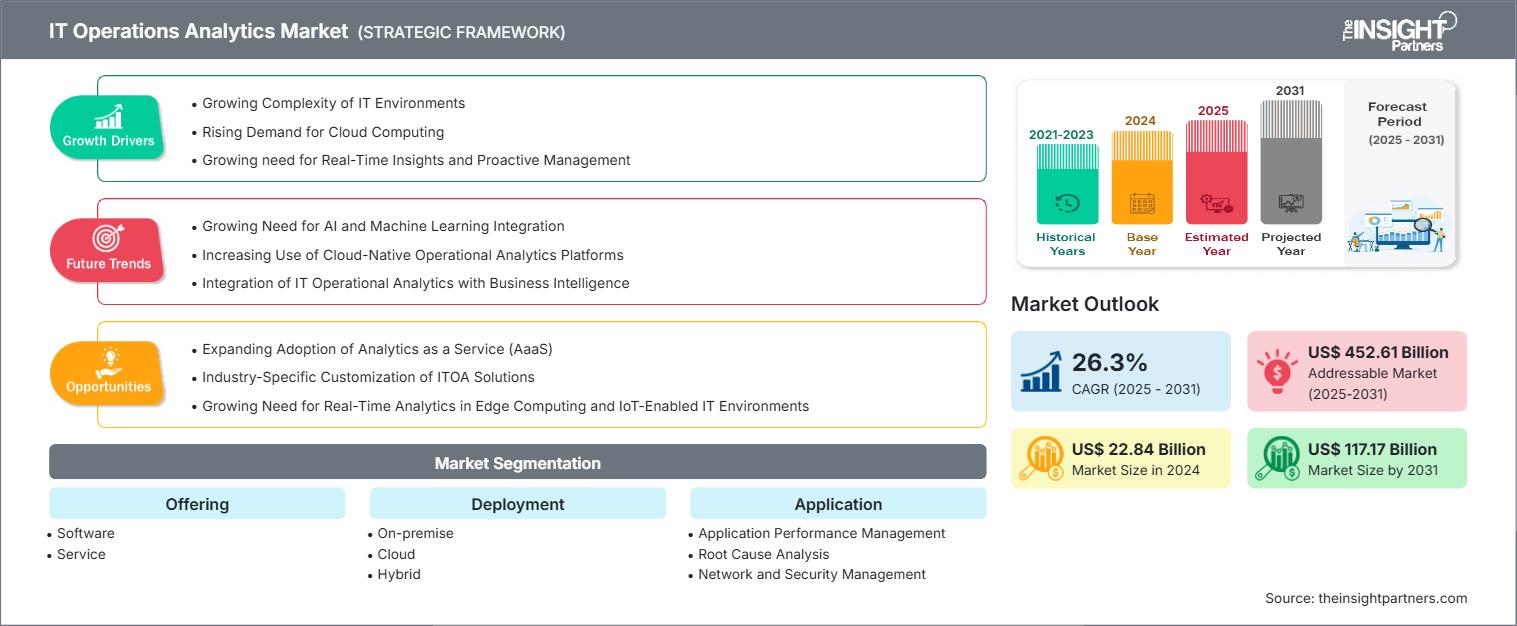
من المتوقع أن يصل حجم سوق تحليلات عمليات تكنولوجيا المعلومات إلى 22.84 مليار دولار أمريكي في عام 2024 ومن المتوقع أن يصل إلى 117.17 مليار دولار أمريكي بحلول عام 2031. ومن المتوقع أن يسجل السوق معدل نمو سنوي مركب بنسبة 26.3٪ خلال الفترة 2025-2031.
تحليل سوق تحليلات عمليات تكنولوجيا المعلومات
يشهد سوق ITOA العالمي توسعًا ملحوظًا مع سعي المؤسسات لتحسين زمن التشغيل، والحفاظ على استمرارية الأعمال، واستخلاص معلومات استخباراتية عملية من بيئات تكنولوجيا المعلومات المعقدة. وتشمل العوامل الرئيسية المحفزة للسوق النمو المتواصل في أحجام البيانات، واعتماد السحابة، وتزايد تعقيد الأنظمة، والحاجة إلى إدارة استباقية للأمن والامتثال. كما أن صعود البنى السحابية الهجينة ومتعددة السحابات، ونشر إنترنت الأشياء، ومبادرات التحول الرقمي، يزيد من فرص اعتماد ITOA. ومع ذلك، فإن عوامل مثل التكلفة العالية لمنصات التحليلات المتقدمة، وصعوبات التكامل مع الأنظمة القديمة، ونقص الكفاءات في مجال التحليلات والذكاء الاصطناعي، يمكن أن تعيق نمو السوق. ورغم هذه القيود، لا يزال الطلب قويًا على الحلول التي تُؤتمت مراقبة الأداء، وتُبسط استكشاف الأخطاء وإصلاحها، وتُمكّن استراتيجيات تكنولوجيا المعلومات القائمة على البيانات.
نظرة عامة على سوق تحليلات عمليات تكنولوجيا المعلومات
يشير تحليل عمليات تكنولوجيا المعلومات (ITOA) إلى استخدام تقنيات تحليل البيانات المتقدمة، والتعلم الآلي، والأتمتة لمراقبة أداء أنظمة تكنولوجيا المعلومات وتقييمه وتحسينه. من خلال تحليل البيانات اللحظية والتاريخية الناتجة عن الشبكات والتطبيقات والبنية التحتية السحابية والأجهزة، يُمكّن تحليل عمليات تكنولوجيا المعلومات (ITOA) فرق تكنولوجيا المعلومات من منع المشاكل، واكتشاف أي خلل، وحل المشكلات بشكل استباقي. يدعم هذا التخصص التحليلي مجموعة متنوعة من التطبيقات، بما في ذلك تحليل السبب الجذري، وتحسين أداء النظام، وإدارة الحوادث، وتخصيص الموارد، ومراقبة الأمان. تشمل مجالات الاستخدام الرئيسية التحليلات التنبؤية لتوقع الانقطاعات، والتصور لرسم خرائط النظام، ومراقبة الأداء، وتتبع الامتثال، وتنسيق الاستجابات الآلية. هناك أنواع عديدة من حلول تحليل عمليات تكنولوجيا المعلومات (ITOA)، مثل أدوات ربط الأحداث، ومنصات بيانات الآلة، ومجموعات المراقبة المدعومة بالذكاء الاصطناعي، وجميعها مصممة لتسريع عمليات تكنولوجيا المعلومات وزيادة كفاءتها وتوجهها نحو الرؤى.
ستحصل على تخصيص لأي تقرير - مجانًا - بما في ذلك أجزاء من هذا التقرير، أو تحليل على مستوى الدولة، وحزمة بيانات Excel، بالإضافة إلى الاستفادة من العروض والخصومات الرائعة للشركات الناشئة والجامعات
سوق تحليلات عمليات تكنولوجيا المعلومات: رؤى استراتيجية
- احصل على أهم اتجاهات السوق الرئيسية من هذا التقرير.ستتضمن هذه العينة المجانية تحليل البيانات، بدءًا من اتجاهات السوق وحتى التقديرات والتوقعات.
محركات وفرص سوق تحليلات عمليات تكنولوجيا المعلومات
محركات السوق:
الطلب المتزايد على الحوسبة السحابية:
لقد أحدث صعود الحوسبة السحابية تحولاً جذرياً في مشهد تحليلات عمليات تكنولوجيا المعلومات (ITOA)، مما ساهم في تسريع نمو السوق من خلال توفير قابلية توسع ومرونة وسهولة غير مسبوقة في دمج أدوات التحليلات. تُولّد بيئات السحابة الحديثة تدفقات ضخمة ومتواصلة من البيانات الجديدة، تشمل التطبيقات والأجهزة وتفاعلات المستخدمين والمعاملات. تستفيد مؤسسات تكنولوجيا المعلومات من حلول تحليلات عمليات تكنولوجيا المعلومات القائمة على السحابة لمعالجة هذه البيانات التشغيلية ووضعها في سياقها، واستخلاص رؤى عملية آنية لتحسين أداء النظام، والاستجابة الاستباقية للحوادث، وتعزيز موثوقية الخدمة.I
الحاجة المتزايدة إلى الرؤى في الوقت الفعلي والإدارة الاستباقية:
تُمكّن أدوات ITOA فرق تكنولوجيا المعلومات من مراقبة سلامة النظام باستمرار، وتتبع مؤشرات الأداء الرئيسية (KPIs)، واكتشاف أي خلل، وتصور التبعيات عبر الشبكات والتطبيقات. تُمكّن تحليلات البيانات الفورية المؤسسات من تحديد الأسباب الجذرية للمشاكل بسرعة، وغالبًا قبل أن تؤثر على المستخدمين النهائيين أو الشركة. على سبيل المثال، يمكن ربط أي حادث يؤثر على أداء النظام فورًا بتغييرات في البنية التحتية أو أنماط الاستخدام، ويمكن توجيه التنبيهات إلى الفرق المعنية لحلها بسرعة، مما يُقلل بشكل كبير من متوسط وقت الإصلاح. وقد استفادت المؤسسات المالية الكبرى من منصات إعداد التقارير الموحدة للتخلص من دورات إعداد التقارير اليدوية، مما يُحوّل أيام الاستجابة المتأخرة إلى دقائق من المعلومات العملية، ويعزز في نهاية المطاف استمرارية الأعمال.
فرص السوق:
توسيع نطاق اعتماد التحليلات كخدمة (AaaS):
في ظلّ مواجهة المؤسسات لأحجام هائلة من البيانات التشغيلية وتعقيدات البنية التحتية المتزايدة، تبرز حلول التحليلات كخدمة (AaaS) كنموذج تقديم فعّال، إذ تُقدّم تحليلات مُدارة وقابلة للتطوير عبر منصات سحابية دون الحاجة إلى استثمارات ضخمة في البنية التحتية. تُدمج منصات AaaS الذكاء الاصطناعي والتعلم الآلي افتراضيًا، مما يُتيح تحليلات آنية، ورؤى تنبؤية فورية. يتوافق هذا النموذج تمامًا مع احتياجات ITOA، حيث تسعى المؤسسات إلى رؤية فورية وقائمة على الذكاء الاصطناعي لعمليات تكنولوجيا المعلومات دون تكاليف تنفيذ باهظة.التخصيص المخصص للصناعة لحلول ITOA:
مع تزايد طلب الشركات في مختلف القطاعات على قدرات مراقبة مُصممة خصيصًا، يُصبح التخصيص المُخصص للقطاعات رافعة نمو قوية لسوق ITOA. غالبًا ما تعجز منصات التحليلات العامة وحدها عن معالجة سير العمل أو متطلبات الامتثال أو هياكل البيانات الخاصة بكل قطاع. عند تخصيص حلول ITOA - مثل التحليلات المُخصصة للتصنيع، أو المراقبة المُركزة على الرعاية الصحية، أو ذكاء الشبكات المُركز على الاتصالات - فإنها تُقدم قيمة أكبر من خلال مواءمتها بشكل أوثق مع واقع الأعمال والتشغيل. على سبيل المثال، يستفيد المُصنّعون الذين يستخدمون إنترنت الأشياء على نطاق واسع من مراقبة الآلات في الوقت الفعلي. وقد مكّنت منصة مراقبة التصنيع من Observata مصنعًا متوسط الحجم لقطع غيار السيارات من تقليل هدر الطاقة وتبسيط بروتوكولات الإنتاج، مما أدى إلى تحسينات في الاستدامة والكفاءة مُصممة خصيصًا لسياق منطقة التجميع.
تقرير تحليلات سوق عمليات تكنولوجيا المعلومات - تحليل التجزئة
يُقسّم سوق تحليلات عمليات تكنولوجيا المعلومات إلى قطاعات مختلفة لإعطاء صورة أوضح عن آلية عمله، وإمكانات نموه، وأحدث التوجهات. فيما يلي نهج التقسيم القياسي المُستخدم في معظم تقارير القطاع:
من خلال العرض:
برمجة:
يُشكّل قطاع البرمجيات جوهر سوق تحليلات عمليات تكنولوجيا المعلومات، إذ يُقدّم منصات وأدوات تُمكّن المؤسسات من مراقبة وتحليل وتحسين أداء البنية التحتية لتكنولوجيا المعلومات والتطبيقات. وتستفيد هذه الحلول البرمجية من الذكاء الاصطناعي والتعلم الآلي والتحليلات الفورية لمعالجة كميات هائلة من البيانات التشغيلية، بما في ذلك السجلات والمقاييس والأحداث والتتبعات.خدمات:
يُكمّل قطاع الخدمات برامج ITOA بتوفير الخبرة والتخصيص والدعم التشغيلي اللازم لتعظيم قيمة منصات التحليلات. ويشمل ذلك الاستشارات والتكامل والتنفيذ والتدريب والدعم المستمر، بالإضافة إلى الخدمات المُدارة التي يُشرف فيها مُزوّدو الخدمات الخارجيون على مهام تحليل عمليات تكنولوجيا المعلومات اليومية. يُساعد مُزوّدو الخدمات على مواءمة أدوات ITOA مع أهداف العمل، وضمان الامتثال للوائح التنظيمية، وتمكين تكامل البيانات بسلاسة عبر الأنظمة.
حسب النشر:
في الموقع:
لا يزال النشر المحلي قطاعًا بالغ الأهمية في سوق تحليلات عمليات تكنولوجيا المعلومات، وخاصةً للمؤسسات العاملة في قطاعات خاضعة للتنظيم، مثل البنوك والحكومة والدفاع والرعاية الصحية. تُولي هذه الجهات الأولوية لسيادة البيانات، والامتثال الصارم، وتشديد الرقابة على البنية التحتية، مما يجعل حلول ITOA المحلية خيارًا مفضلًا. يوفر هذا النموذج تخصيصًا وأمانًا مُحسّنين، مما يسمح للمؤسسات بتخصيص منصات التحليلات بما يتناسب مع بيئات تشغيلية وسياسات داخلية محددة.سحاب:
يُعدّ نشر السحابة أسرع القطاعات نموًا في سوق تحليلات عمليات تكنولوجيا المعلومات، مدفوعًا بالتحول نحو بنية تحتية رقمية قابلة للتطوير ومرنة ومتوفرة عند الطلب. توفر منصات ITOA السحابية نشرًا سريعًا، وتكاليف صيانة منخفضة، وتحديثات مستمرة، مما يجعلها مثالية لبيئات DevOps الحديثة والمرنة. تدعم هذه الحلول مراقبة الموارد الديناميكية، والتحليلات الفورية، والتكامل السلس عبر أنظمة SaaS وPaaS وIaaS.هجين:
يُمثل النشر الهجين حلاً وسطاً استراتيجياً في سوق تحليلات عمليات تكنولوجيا المعلومات، إذ يوفر مرونةً في مراقبة الأنظمة السحابية والمحلية على حد سواء. ويزداد انتشاره بين الشركات الكبيرة التي تشهد تحولاً رقمياً، ولكنها لا تزال تعتمد على البنية التحتية القديمة.
حسب التطبيق:
- إدارة أداء التطبيقات (APM)
- تحليل السبب الجذري (RCA)
- إدارة الشبكات والأمن
- آحرون
الصناعة العمودية:
- الخدمات المصرفية والمالية والتأمين
- تجارة التجزئة والتجارة الإلكترونية
- تكنولوجيا المعلومات والاتصالات
- الرعاية الصحية
- تصنيع
- آحرون
حسب الجغرافيا:
- أمريكا الشمالية
- أوروبا
- آسيا والمحيط الهادئ
- أمريكا الجنوبية والوسطى
- الشرق الأوسط وأفريقيا
يُعد سوق تحليلات عمليات تكنولوجيا المعلومات في أمريكا الشمالية الأكبر عالميًا، بفضل التبني المبكر للسحابة، ورقمنة المؤسسات واسعة النطاق، والتركيز الكبير على الأتمتة والأمن السيبراني. تستضيف الولايات المتحدة وكندا عددًا كبيرًا من شركات فورتشن 500، وموفري خدمات السحابة الضخمة، والقطاعات المعتمدة على التكنولوجيا مثل التمويل والاتصالات والتجارة الإلكترونية والرعاية الصحية، والتي تعتمد جميعها اعتمادًا كبيرًا على مراقبة الأداء في الوقت الفعلي وقدرات عمليات الذكاء الاصطناعي (AIOps).
رؤى إقليمية حول سوق تحليلات عمليات تكنولوجيا المعلومات
قام محللو شركة The Insight Partners بشرح شامل للاتجاهات والعوامل الإقليمية المؤثرة في سوق تحليلات عمليات تكنولوجيا المعلومات خلال فترة التوقعات. ويناقش هذا القسم أيضًا قطاعات سوق تحليلات عمليات تكنولوجيا المعلومات ونطاقها الجغرافي في أمريكا الشمالية، وأوروبا، وآسيا والمحيط الهادئ، والشرق الأوسط وأفريقيا، وأمريكا الجنوبية والوسطى.
نطاق تقرير سوق تحليلات عمليات تكنولوجيا المعلومات
| سمة التقرير | تفاصيل |
|---|---|
| حجم السوق في عام 2024 | 22.84 مليار دولار أمريكي |
| حجم السوق بحلول عام 2031 | 117.17 مليار دولار أمريكي |
| معدل النمو السنوي المركب العالمي (2025 - 2031) | 26.3% |
| البيانات التاريخية | 2021-2023 |
| فترة التنبؤ | 2025-2031 |
| القطاعات المغطاة | عن طريق العرض
|
| المناطق والبلدان المغطاة | أمريكا الشمالية
|
| قادة السوق وملفات تعريف الشركات الرئيسية |
|
كثافة اللاعبين في سوق تحليلات عمليات تكنولوجيا المعلومات: فهم تأثيرها على ديناميكيات الأعمال
يشهد سوق تحليلات عمليات تكنولوجيا المعلومات نموًا سريعًا، مدفوعًا بتزايد طلب المستخدمين النهائيين نتيجةً لعوامل مثل تطور تفضيلات المستهلكين، والتقدم التكنولوجي، وزيادة الوعي بمزايا المنتج. ومع تزايد الطلب، تعمل الشركات على توسيع عروضها، والابتكار لتلبية احتياجات المستهلكين، والاستفادة من الاتجاهات الناشئة، مما يعزز نمو السوق.
- احصل على نظرة عامة على أهم اللاعبين الرئيسيين في سوق تحليلات عمليات تكنولوجيا المعلومات
تحليل حصة سوق تحليلات عمليات تكنولوجيا المعلومات حسب المنطقة الجغرافية
تبرز منطقة آسيا والمحيط الهادئ كواحدة من أسرع الأسواق نموًا في مجال تحليلات عمليات تكنولوجيا المعلومات، مدفوعةً بالتحول الرقمي السريع، واستراتيجيات الصناعة 4.0 والمدن الذكية، ومبادرات البنية التحتية الذكية. وتُعدّ دولٌ مثل الصين والهند واليابان وكوريا الجنوبية وسنغافورة وأستراليا من أبرز المساهمين في هذا المجال، ولكلٍّ منها دوافعها الخاصة. وتُطبّق الشركات الناشئة وشركات الاتصالات في هذه الدول أدوات تحليل عمليات تكنولوجيا المعلومات (ITOA) لدعم منصات المستهلكين واسعة النطاق التي تُركّز على الأجهزة المحمولة.
ينمو سوق تحليلات عمليات تكنولوجيا المعلومات بشكل مختلف من منطقة لأخرى. ويعود ذلك إلى عوامل مثل التحول الرقمي، والتقدم التكنولوجي، والتوسع الصناعي. فيما يلي ملخص لحصة السوق واتجاهاتها حسب المنطقة:
1. أمريكا الشمالية
الحصة السوقية:
تتمتع بحصة كبيرة من سوق تحليلات عمليات تكنولوجيا المعلومات العالمية
العوامل الرئيسية:
- التبني المبكر للسحابة
- رقمنة المؤسسات واسعة النطاق
- التركيز القوي على الأتمتة والأمن السيبراني
الاتجاهات:
الابتكار في أدوات المراقبة السحابية الأصلية، ومراقبة البنية التحتية الهجينة، وحلول ITOA المتكاملة أمنيًا
2. أوروبا
الحصة السوقية:
حصة كبيرةالعوامل الرئيسية:
- قوانين صارمة لحوكمة البيانات
- متطلبات الامتثال الخاصة بالصناعة
- دفع متزايد نحو السيادة الرقمية.
الاتجاهات:
الطلب على منصات التحليلات المعيارية التي تراعي السياسات، والشركات التي تعمل على تحديث البنية التحتية القديمة، والانتقال إلى نماذج السحابة أو النماذج الهجينة
3. آسيا والمحيط الهادئ
الحصة السوقية:
المنطقة الأسرع نموًا مع ارتفاع حصة السوق كل عامالعوامل الرئيسية:
- تسريع اعتماد السحابة
- مبادرات البنية التحتية الذكية
- التحول الرقمي واسع النطاق عبر الاقتصادات الناشئة والمتقدمة
الاتجاهات:
الاستثمار في ITOA كجزء من استراتيجيات الصناعة 4.0 الأوسع نطاقًا والمدينة الذكية والتركيز العالي على اكتشاف الشذوذ في الوقت الفعلي
4. أمريكا الجنوبية والوسطى
الحصة السوقية:
سوق متنامية مع تقدم مطردالعوامل الرئيسية:
- زيادة الاستثمار الحكومي في البنية التحتية الرقمية
- المدن الذكية وتحديث القطاع العام
الاتجاهات:
استراتيجيات وطنية تركز على الذكاء الاصطناعي والحوسبة السحابية والتحول الرقمي
5. الشرق الأوسط وأفريقيا
الحصة السوقية:
رغم صغر حجمها، إلا أنها تنمو بسرعةالعوامل الرئيسية:
- التحول الرقمي
- تزايد الرغبة في عمليات تكنولوجيا المعلومات الذكية، وخاصة في قطاعات مثل الخدمات المصرفية والاتصالات والخدمات الحكومية
الاتجاهات:
تتبنى المؤسسات بشكل متزايد أدوات ITOA للتعامل مع التحديات المتعلقة بتوفر النظام وزمن انتقال الشبكة وتحسين الموارد.
كثافة اللاعبين في سوق تحليلات عمليات تكنولوجيا المعلومات: فهم تأثيرها على ديناميكيات الأعمال
كثافة السوق العالية والمنافسة
المنافسة قوية بفضل وجود لاعبين راسخين مثل شركة International Business Machines Corp، وشركة Cisco Systems Inc، وشركة New Relic Inc، وشركة Dynatrace LLC، وشركة ServiceNow Inc. بالإضافة إلى ذلك، تساهم شركات إقليمية ومتخصصة مثل شركة Oracle Corp، وشركة BMC Software, Inc.، وشركة Microsoft Corp، وشركة Open Text Corp، وشركة Broadcom Inc في خلق بيئة ديناميكية وتنافسية.
هذا المستوى العالي من المنافسة يحث الشركات على التميز من خلال تقديم:
- تقنيات التحقيق المتقدمة (على سبيل المثال، التحليلات المعتمدة على الذكاء الاصطناعي، والتعلم الآلي، والتحليلات كخدمة (AaaS))
- دعم الطب الشرعي عبر الأنظمة الأساسية (دعم البنية التحتية الهجينة بما في ذلك البيئات المحلية والسحابية والحافة)
- حلول تركز على الامتثال للوائح مثل GDPR وCCPA وSOX
- تحليل سريع للسبب الجذري والمعالجة الآلية
الفرص والتحركات الاستراتيجية
- أصبحت التحالفات الاستراتيجية مع بائعي AIOps ومقدمي الخدمات السحابية وفرق DevOps ضرورية لتوسيع قدرات المنصة وتسريع مبادرات التحول الرقمي.
- تكتسب حلول ITOA السحابية الأصلية ونماذج ITOA كخدمة زخمًا متزايدًا، مدفوعة بالحاجة إلى قابلية التوسع والمرونة ومعالجة البيانات في الوقت الفعلي.
- يفتح التوسع في المناطق الناشئة (آسيا والمحيط الهادئ والشرق الأوسط وأميركا اللاتينية) آفاقًا جديدة للنمو مع قيام المؤسسات بتحديث البنية التحتية لتكنولوجيا المعلومات لديها والبحث عن أدوات إدارة تكنولوجيا المعلومات الاستباقية.
- إن استثمارات البحث والتطوير في مجال الذكاء الاصطناعي والتعلم الآلي والتحليلات التنبؤية تمكن من الكشف الآلي عن الشذوذ وتحليل السبب الجذري والتنبؤ بالأداء.
- يؤدي التكامل مع منصات ITSM وAPM وNPM والقدرة على المراقبة إلى تعزيز الرؤية وتقليل متوسط الوقت المستغرق للحل (MTTR) ودعم استراتيجيات المراقبة الموحدة.
الشركات الرئيسية العاملة في سوق تحليلات عمليات تكنولوجيا المعلومات هي:
- شركة آلات الأعمال الدولية
- شركة دايناتريس ذ.م.م
- شركة النص المفتوح
- شركة سيسكو سيستمز
- شركة بي إم سي للبرمجيات
- شركة مايكروسوفت
- شركة نيو ريليك
- شركة برودكوم
- شركة سيرفيس ناو
- شركة أوراكل
إخلاء المسؤولية: الشركات المذكورة أعلاه ليست مرتبة بأي ترتيب معين.
الشركات الأخرى التي تم تحليلها أثناء البحث:
- شركة سيسنس المحدودة
- شركة سولارويندز العالمية المحدودة
- شركة هيتاشي فانتارا
- شركة نت آب
- مرن
- برودكوم
- هيوليت باكارد إنتربرايز
- منطق السومو
- إكسابيم
- شركة PagerDuty، المحدودة
- لوجيك مونيتور
- شركة ديل
- ساينس لوجيك
- داتادوغ
- شركة زوهو المحدودة
- أطلسيان
- شركة فريش ووركس
- أنكر
- ألتيريكس
- نيكستثينك
- تقنيات إتش سي إل
- مجموعة برمجيات السحابة
- فيريتاس
- شبكات إكسترا هوب
- أبيكا
أخبار سوق تحليلات عمليات تكنولوجيا المعلومات والتطورات الأخيرة
قدمت شركة IBM قدرات جديدة للوكالة والأتمتة
في أبريل 2025، أضافت IBM قدرات جديدة للذكاء الاصطناعي والأتمتة إلى خدمات الكشف والاستجابة المُدارة التي تقدمها، وذلك لتمكين عمليات الأمن المستقلة وجمع معلومات استخباراتية تنبؤية عن التهديدات للعملاء. وتطلق IBM نظام Autonomous Threat Operations Machine (ATOM)، وهو نظام ذكاء اصطناعي قائم على الذكاء الاصطناعي يوفر فرزًا ذاتيًا للتهديدات والتحقيق فيها ومعالجتها مع الحد الأدنى من التدخل البشري. كما تُقدم IBM نظام X-Force Predictive Threat Intelligence (PTI) الجديد لنظام ATOM، والذي يعتمد على نماذج الذكاء الاصطناعي الأساسية الخاصة بقطاعات الصناعة المختلفة لتوليد رؤى استخباراتية تنبؤية حول التهديدات المحتملة، والحد من جهود البحث اليدوي عن التهديدات.قدمت شركة Cisco إمكانيات جديدة في Cisco XDR وSplunk Security
في أبريل 2025، أعلنت سيسكو عن ابتكارات وشراكات رئيسية لمساعدة فرق الأمن على مواجهة التحديات المتزايدة في عصر الذكاء الاصطناعي. قدمت الشركة قدرات جديدة في Cisco XDR وSplunk Security، وشراكة أعمق مع ServiceNow، وأطلقت Foundation AI.أعلنت Dynatrace عن إمكانيات تحليل السجلات الجديدة المدعومة بالذكاء الاصطناعي
في فبراير 2025، أعلنت Dynatrace، المنصة الرائدة للمراقبة المدعومة بالذكاء الاصطناعي، عن قدرات جديدة لتحليل السجلات مدعومة بالذكاء الاصطناعي لمواجهة التحديات المتزايدة التي تواجهها المؤسسات مع حلول إدارة السجلات القديمة. غالبًا ما تعمل الحلول القديمة بشكل مستقل عن أدوات المراقبة الحالية، مما يُديم أوجه القصور التشغيلية التي تؤدي إلى تأخير حل الحوادث وزيادة التكاليف وثغرات أمنية.قامت شركة BMC بتحديث منصة BMC Helix الخاصة بها
في مايو 2025، أعلنت BMC Helix، الشركة الرائدة عالميًا في حلول البرمجيات التي تُمكّن مؤسسات تكنولوجيا المعلومات الأكثر استشرافًا للمستقبل في العالم من تطبيق الذكاء الاصطناعي عمليًا، عن تحديثات لمنصة BMC Helix تُحسّن الإنتاجية وتُحسّن تجربة الموظفين من خلال الذكاء الاصطناعي الوكيل. تُعدّ منصة Helix من أوائل الحلول الجاهزة للسوق التي تستخدم جيل الذكاء الاصطناعي، وتُحسّن جودة تفاعلات الخدمة وتجربة المُشغّل بشكل عام من خلال الرؤى والأتمتة. يتضمن إصدار BMC Helix IT Operations Management for AIOps 25.2 وكلاء ذكاء اصطناعي جدد ومُوسّعين لتعزيز إمكانية المراقبة والاكتشاف والرؤى التي تمنع الحوادث الكبرى وتُحسّن أداء التطبيقات.BMC تضيف الذكاء الاصطناعي التوليدي والتطوير منخفض/بدون كود
في ديسمبر 2023، أضافت BMC، الشركة الرائدة عالميًا في حلول البرمجيات للمؤسسات الرقمية المستقلة، الذكاء الاصطناعي التوليدي والتطوير منخفض الكود/بدون كود والأدوات السياقية إلى حل إدارة خدمة BMC Helix، مما يساعد عملاء المؤسسات على تعزيز وضعهم الأمني وتحسين طرق العمل.
تغطية تقرير سوق تحليلات عمليات تكنولوجيا المعلومات والمنتجات النهائية
يوفر تقرير "حجم سوق تحليلات عمليات تكنولوجيا المعلومات والتوقعات (2021-2031)" تحليلاً مفصلاً للسوق يغطي المجالات التالية:
- حجم سوق تحليلات عمليات تكنولوجيا المعلومات وتوقعاته على المستويات العالمية والإقليمية والوطنية لجميع قطاعات السوق الرئيسية التي يغطيها النطاق
- اتجاهات سوق تحليلات عمليات تكنولوجيا المعلومات، بالإضافة إلى ديناميكيات السوق مثل المحركات والقيود والفرص الرئيسية
- تحليل مفصل لـ PEST و SWOT
- تحليلات سوق عمليات تكنولوجيا المعلومات تغطي اتجاهات السوق الرئيسية والإطار العالمي والإقليمي والجهات الفاعلة الرئيسية واللوائح والتطورات الأخيرة في السوق
- تحليل المشهد الصناعي والمنافسة الذي يغطي تركيز السوق، وتحليل الخريطة الحرارية، واللاعبين البارزين، والتطورات الأخيرة لسوق تحليلات عمليات تكنولوجيا المعلومات
- ملفات تعريف الشركة التفصيلية

أنكيتا خبيرة ديناميكية في أبحاث السوق والاستشارات، تتمتع بخبرة تزيد عن 8 سنوات في قطاعات التكنولوجيا والإعلام وتكنولوجيا المعلومات والاتصالات والإلكترونيات وأشباه الموصلات. وقد قادت ونفذت بنجاح أكثر من 100 مهمة استشارية وبحثية لعملاء عالميين مثل مايكروسوفت وأوراكل وشركة NEC وSAP وKPMG وExpeditors International. تشمل كفاءاتها الأساسية تقييم السوق، وتحليل البيانات، والتنبؤ، وصياغة الاستراتيجيات، والاستخبارات التنافسية، وكتابة التقارير.
أنكيتا بارعة في إدارة دورات المشاريع الكاملة، بدءًا من تصميم عروض ما قبل البيع ومناقشات العملاء، وصولًا إلى تقديم رؤى عملية بعد البيع. كما أنها ماهرة في إدارة فرق متعددة الوظائف، وهيكلة وحدات بحثية معقدة، ومواءمة الحلول مع أهداف العمل الخاصة بالعملاء. وقد مكنتها مهاراتها الممتازة في التواصل والقيادة والعرض التقديمي من تحقيق نتائج قيّمة باستمرار في بيئات سوقية سريعة التطور.
- التحليل التاريخي (سنتان)، سنة الأساس، التوقعات (7 سنوات) مع معدل النمو السنوي المركب
- تحليل PEST و SWOT
- حجم السوق والقيمة / الحجم - عالمي، إقليمي، بلد
- الصناعة والمنافسة
- مجموعة بيانات إكسل
التقارير الحديثة
شهادات العملاء
تقرير سوق أنظمة SCADA من Insight Partners شامل، ويقدم رؤى قيّمة حول الاتجاهات الحالية والتوقعات المستقبلية. تميّز الفريق باحترافية عالية وسرعة في الاستجابة ودعم مستمر طوال الوقت. نحن راضون جدًا ونوصي بشدة بخدماتهم.
ران كيديم شريك, شركة ريالي تكنولوجيز المحدودةطلبتُ تقريرًا عن سوق برمجيات محدد، وأعدّه الفريق في غضون أيام قليلة. كانت المعلومات ذات صلة وثيقة وعرضها جيد. ثم طلبتُ بعض التعديلات والإضافات على التقرير. وكان الفريق متجاوبًا للغاية، وحصلتُ على التقرير النهائي في أقل من أسبوع.
جان هيرفيه جين رئيس مجلس الإدارة, فيوتشر أناليتيكاعملنا مع شركة "إنسايت بارتنرز" لإجراء دراسة سوقية وتوقعات مهمة. زودونا برؤى واضحة حول الفرص والمخاطر، مما ساعدنا في صياغة خططنا. كانت أبحاثهم سهلة الاستخدام ومبنية على بيانات دقيقة، مما ساعدنا على اتخاذ قرارات ذكية وواثقة. نوصي بهم بشدة.
بيوش ناجبال نائب الرئيس الأول, شعاع عالي عالميقدّمت شركة Insight Partners أبحاثًا سوقية ثاقبة ومنظمة جيدًا بخبرة واسعة في هذا المجال. تميّز فريقهم بالاحترافية وسرعة الاستجابة طوال الوقت. وسهّل موقعهم الإلكتروني سهل الاستخدام الوصول إلى تقارير القطاع. نوصي بهم بشدة لخدمات بحثية موثوقة وعالية الجودة.
يوكيهيكو أداتشي المدير التنفيذي, ديب بلو، ذ.م.م.هذه أول مرة أشتري فيها تقرير سوق من The Insight Partners. رغم أنني كنت مترددًا في البداية، إلا أنني زرت موقعهم الإلكتروني وشعرت براحة أكبر للمخاطرة وشراء تقرير السوق. أنا راضٍ تمامًا عن جودة التقرير وخدمة العملاء. كانت لديّ عدة أسئلة وتعليقات حول التقرير الأولي، ولكن بعد بضع محادثات عبر البريد الإلكتروني مع محللهم، أعتقد أن لديّ تقريرًا يمكنني استخدامه كمدخل لعملية التخطيط الاستراتيجي لدينا. شكرًا جزيلاً لكم على تخصيص وقتكم الإضافي وجعل هذه التجربة إيجابية. سأوصي بخدماتكم للآخرين بالتأكيد، وستكونون أول من ألجأ إليه عندما نحتاج إلى المزيد من بيانات السوق.
جون سوزوكي الرئيس والرئيس التنفيذي وعضو مجلس الإدارة, بي كيه تكنولوجيزأود أن أقدّر دعمكم واحترافيتكم في الاستجابة لطلبي للحصول على معلومات بشأن سوق التشخيص المخبري للأمراض المعدية في نيجيريا. كما أُقدّر صبركم وتوجيهكم، واستعدادكم لتقديم خصم، مما مكّننا في النهاية من إتمام الصفقة. أتطلع إلى التعامل مع "ذا إنسايت بارتنرز" مستقبلًا، كل ذلك بفضل الانطباع الذي تركتموه لديّ نتيجةً لهذا اللقاء الأول.
الدكتور تشيجيوك أونيا المدير الإداري, شركة باينكريست للرعاية الصحية المحدودةسبب الشراء
- اتخاذ قرارات مدروسة
- فهم ديناميكيات السوق
- تحليل المنافسة
- رؤى العملاء
- توقعات السوق
- تخفيف المخاطر
- التخطيط الاستراتيجي
- مبررات الاستثمار
- تحديد الأسواق الناشئة
- تحسين استراتيجيات التسويق
- تعزيز الكفاءة التشغيلية
- مواكبة التوجهات التنظيمية


 احصل على عينة مجانية ل - سوق تحليلات عمليات تكنولوجيا المعلومات