Marktgröße, Trends, Anteile und Prognose für virtuelle Produktion – 2030
Historische Daten : 2021-2022 | Basisjahr : 2023 | Prognosezeitraum : 2024-2031Marktgröße und Prognose für virtuelle Produktion (2021 – 2031), Berichtsabdeckung zu globalen und regionalen Anteilen, Trends und Wachstumschancen: Komponente (Lösung und Dienste) und Endbenutzer (Filme, Fernsehserien, Werbespots und Online-Videos) sowie Geografie
- Status : Veröffentlichte Daten
- Berichtscode : TIPRE00019499
- Kategorie : Technologie, Medien und Telekommunikation
- Anzahl der Seiten : 150
- Verfügbare Berichtsformate :


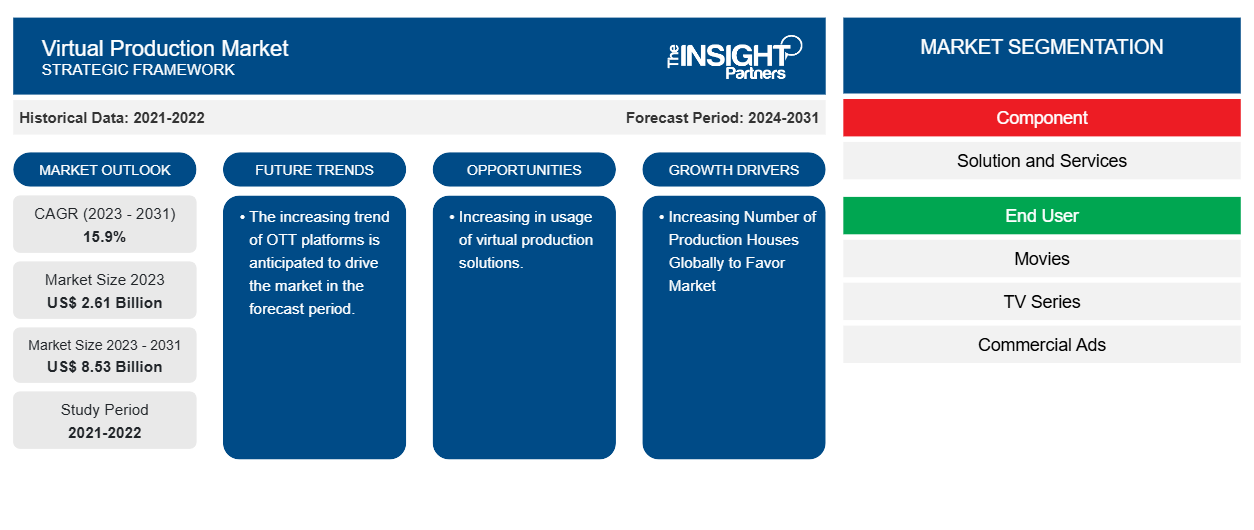
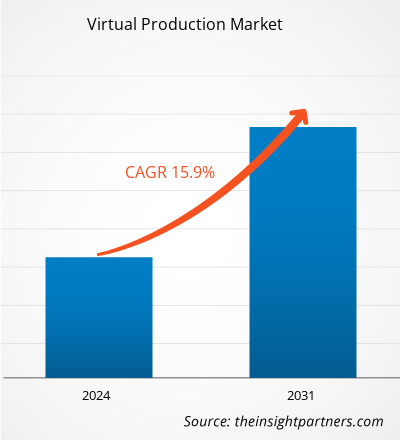
Der Markt für virtuelle Produktionen soll von 2,61 Milliarden US-Dollar im Jahr 2023 auf 8,53 Milliarden US-Dollar im Jahr 2031 anwachsen. Der Markt wird zwischen 2023 und 2031 voraussichtlich eine durchschnittliche jährliche Wachstumsrate von 15,9 % verzeichnen. Die steigende Zahl von Produktionshäusern weltweit und die verbesserten Kosten- und Zeiteinsparungen für Produktionshäuser und Inhaltsersteller dürften weiterhin wichtige Trends und Treiber des Marktes bleiben.
Marktanalyse für virtuelle Produktion
Der Markt für virtuelle Produktionen verzeichnet weltweit ein erhebliches Wachstum. Das Wachstum ist auf die steigende Zahl von Produktionshäusern weltweit und die gestiegenen Kosten- und Zeiteinsparungen für Produktionshäuser und Inhaltsersteller zurückzuführen. Darüber hinaus wird erwartet, dass die zunehmende Nutzung virtueller Produktionslösungen und der steigende Trend zu OTT-Plattformen dem Markt für virtuelle Produktion zahlreiche Chancen bieten.
Marktübersicht für virtuelle Produktion
Virtuelle Produktion ist eine Medienproduktionstechnologie, bei der ein virtuelles Set auf großen LED- Wänden hinter einem physischen Set angezeigt wird. Teams verwenden Echtzeit-3D-Engines (Game-Engines), um ein virtuelles Set zu erstellen, es auf der LED-Wand anzuzeigen und die Engines dann mit Kameras am Set zu synchronisieren, um mehr Realismus und perspektivische Tiefe zu erzielen.
Passen Sie diesen Bericht Ihren Anforderungen an
Sie erhalten kostenlos individuelle Anpassungen an jedem Bericht, einschließlich Teilen dieses Berichts oder einer Analyse auf Länderebene, eines Excel-Datenpakets sowie tolle Angebote und Rabatte für Start-ups und Universitäten.
Markt für virtuelle Produktion: Strategische Einblicke
-
Holen Sie sich die wichtigsten Markttrends aus diesem Bericht.Dieses KOSTENLOSE Beispiel umfasst eine Datenanalyse von Markttrends bis hin zu Schätzungen und Prognosen.
Treiber und Chancen auf dem Markt für virtuelle Produktion
Steigende Anzahl von Produktionshäusern weltweit begünstigt den Markt
Die steigende Zahl von Produktionsfirmen kann die virtuelle Produktion auf verschiedene Weise vorantreiben. Je mehr Produktionsfirmen gebaut werden, desto mehr steigt die Nachfrage nach effizienten und kostengünstigen Produktionsmethoden. Die virtuelle Produktion ermöglicht es Produktionsfirmen, größer zu bauen, innovativer zu sein und früher im Produktionsprozess qualitativ hochwertige Ergebnisse zu liefern. Darüber hinaus spart die virtuelle Produktion vielen Produktionsfirmen Zeit und Kosten. Durch virtuelles Scouting, bei dem virtuelle Versionen vorgeschlagener Sets erstellt werden, können Reisezeit und zusätzliche Kosten reduziert werden. Durch innovative Entscheidungen zu einem früheren Zeitpunkt im Prozess wird sichergestellt, dass die richtigen Entscheidungen getroffen werden können. Unter Berücksichtigung der oben genannten Parameter treibt die weltweit steigende Zahl von Produktionsfirmen das Wachstum des Marktes für virtuelle Produktion voran.
Zunehmende Nutzung virtueller Produktionslösungen.
Die zunehmende Nutzung virtueller Produktionslösungen dürfte dem Markt für virtuelle Produktionen viele Chancen eröffnen. Verschiedene Branchen implementieren virtuelle Produktionen, was die Nachfrage nach virtuellen Produktionslösungen erhöht. Dies kann neue Akteure und Investitionen anlocken und zu Innovationen und Expansion führen. Darüber hinaus wird virtuelle Produktion nicht nur in den Bereichen Medien und Unterhaltung, sondern auch in der Werbung , bei Live-Events, Spielen und anderen Bereichen eingesetzt. Diese Art der virtuellen Produktion kann neue Umsatz- und Kundenstämme erschließen.
Segmentierungsanalyse des Marktberichts zur virtuellen Produktion
Wichtige Segmente, die zur Ableitung der Marktanalyse zur virtuellen Produktion beigetragen haben, sind Komponenten und Endbenutzer.
- Basierend auf den Komponenten wird der Markt für virtuelle Produktion in Lösungen und Dienstleistungen unterteilt. Das Lösungssegment dürfte im Prognosezeitraum einen erheblichen Marktanteil halten.
- Basierend auf dem Endbenutzer ist der Markt für virtuelle Produktionen in Filme, Fernsehserien, Werbespots und Online-Videos unterteilt. Es wird erwartet, dass der Film im Prognosezeitraum einen erheblichen Marktanteil halten wird.
Virtuelle Produktion – Marktanteilsanalyse nach geografischer Lage
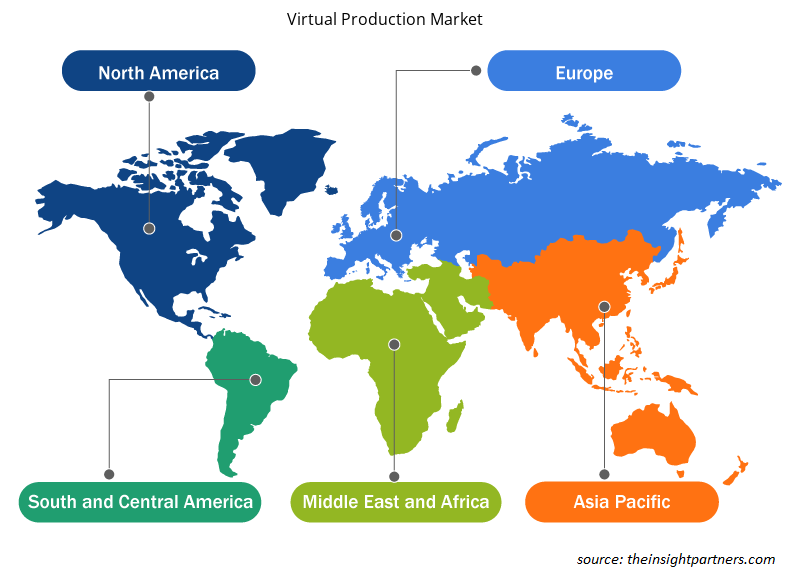
Der geografische Umfang des Marktberichts zur virtuellen Produktion ist hauptsächlich in fünf Regionen unterteilt: Nordamerika, Asien-Pazifik, Europa, Naher Osten und Afrika sowie Süd- und Mittelamerika.
Nordamerika dominiert den Markt für virtuelle Produktion. Der nordamerikanische Markt für virtuelle Produktion ist in die USA, Kanada und Mexiko unterteilt. Außerdem erlebt der Markt ein erhebliches Wachstum. Dieses Wachstum ist auf die steigende Zahl von Produktionshäusern weltweit und die erhöhten Kosten- und Zeiteinsparungen für Produktionshäuser und Inhaltsersteller in der Region zurückzuführen. Darüber hinaus wird erwartet, dass die zunehmende Nutzung virtueller Produktionslösungen und der steigende Trend zu OTT-Plattformen mehrere Chancen für den nordamerikanischen Markt für virtuelle Produktion bieten. Darüber hinaus zwingt eine starke Betonung von Forschung und Entwicklung in den entwickelten Volkswirtschaften der USA und Kanadas die nordamerikanischen Akteure dazu, technologisch fortschrittliche Lösungen auf den Markt zu bringen. Darüber hinaus gibt es in den USA eine große Anzahl von Akteuren auf dem Markt für virtuelle Produktion, die sich zunehmend auf die Entwicklung innovativer Lösungen konzentrieren. All diese Faktoren tragen zum Wachstum des Marktes für virtuelle Produktion in der Region bei.
Virtuelle Produktion
Regionale Einblicke in den Markt für virtuelle Produktion
Die regionalen Trends und Faktoren, die den Markt für virtuelle Produktion im gesamten Prognosezeitraum beeinflussen, wurden von den Analysten von Insight Partners ausführlich erläutert. In diesem Abschnitt werden auch Marktsegmente und Geografien für virtuelle Produktion in Nordamerika, Europa, im asiatisch-pazifischen Raum, im Nahen Osten und Afrika sowie in Süd- und Mittelamerika erörtert.
- Holen Sie sich regionale Daten zum Markt für virtuelle Produktion
Umfang des Marktberichts zur virtuellen Produktion
| Berichtsattribut | Details |
|---|---|
| Marktgröße im Jahr 2023 | 2,61 Milliarden US-Dollar |
| Marktgröße bis 2031 | 8,53 Milliarden US-Dollar |
| Globale CAGR (2023 - 2031) | 15,9 % |
| Historische Daten | 2021-2022 |
| Prognosezeitraum | 2024–2031 |
| Abgedeckte Segmente |
Nach Komponente
|
| Abgedeckte Regionen und Länder |
Nordamerika
|
| Marktführer und wichtige Unternehmensprofile |
|
Dichte der Marktteilnehmer für virtuelle Produktion: Deren Auswirkungen auf die Geschäftsdynamik verstehen
Der Markt für virtuelle Produktion wächst rasant, angetrieben durch die steigende Nachfrage der Endnutzer aufgrund von Faktoren wie sich entwickelnden Verbraucherpräferenzen, technologischen Fortschritten und einem größeren Bewusstsein für die Vorteile des Produkts. Mit steigender Nachfrage erweitern Unternehmen ihr Angebot, entwickeln Innovationen, um die Bedürfnisse der Verbraucher zu erfüllen, und nutzen neue Trends, was das Marktwachstum weiter ankurbelt.
Die Marktteilnehmerdichte bezieht sich auf die Verteilung der Firmen oder Unternehmen, die in einem bestimmten Markt oder einer bestimmten Branche tätig sind. Sie gibt an, wie viele Wettbewerber (Marktteilnehmer) in einem bestimmten Marktraum im Verhältnis zu seiner Größe oder seinem gesamten Marktwert präsent sind.
Die wichtigsten auf dem Markt für virtuelle Produktion tätigen Unternehmen sind:
- 360Rize
- INSTA 360
- Boris FX
- Epische Spiele; Inc
- Brompton Technology GmbH
- Adobe Inc.
Haftungsausschluss : Die oben aufgeführten Unternehmen sind nicht in einer bestimmten Reihenfolge aufgeführt.
- Überblick über die wichtigsten Akteure auf dem Markt für virtuelle Produktion
Neuigkeiten und aktuelle Entwicklungen zum Markt der virtuellen Produktion
Der Markt für virtuelle Produktion wird durch die Erhebung qualitativer und quantitativer Daten nach Primär- und Sekundärforschung bewertet, die wichtige Unternehmensveröffentlichungen, Verbandsdaten und Datenbanken umfasst. Nachfolgend sind einige der Entwicklungen auf dem Markt für virtuelle Produktion aufgeführt:
- Dimension hat die Einführung von DNEG 360 angekündigt, das Dimension‘s Expertise in der Echtzeitproduktion mit DNEG‘s weltweit führenden visuellen Unterhaltungsdiensten kombiniert. Parallel zur Einführung von DNEG 360 hat das Unternehmen einen exklusiven Blick hinter die Kulissen veröffentlicht: „Die Evolution der virtuellen Produktion“, um seine fortschrittlichen Techniken und Fortschritte bei der virtuellen Produktion vorzustellen. (Quelle: Dimension Company Website, April 2024)
- Die Vancouver Film School hat sich mit Pixomondo (PXO) zusammengetan, um VFS-Studenten ein neues Angebot zu unterbreiten. Virtual Art Department Content Creation ist ein 12-wöchiges Zertifikatsprogramm, das von Pixomondo entwickelt wurde, um Kreativen die Grundlagen der Inhaltserstellung für die virtuelle Produktion in VFX beizubringen. (Quelle: Pixomondo (PXO) Unternehmenswebsite, April 2024)
Marktbericht zur virtuellen Produktion – Abdeckung und Ergebnisse
Der Bericht „Marktgröße und Prognose für virtuelle Produktion (2021–2031)“ bietet eine detaillierte Analyse des Marktes, die die folgenden Bereiche abdeckt:
- Größe und Prognose des Marktes für virtuelle Produktion auf globaler, regionaler und Länderebene für alle abgedeckten wichtigen Marktsegmente.
- Markttrends sowie Marktdynamiken im Bereich virtuelle Produktion wie treibende Kräfte, Hemmnisse und wichtige Chancen.
- Detaillierte PEST/Porters Five Forces- und SWOT-Analyse.
- Analyse des Marktes für virtuelle Produktion, die wichtige Markttrends, globale und regionale Rahmenbedingungen, wichtige Akteure, Vorschriften und aktuelle Marktentwicklungen umfasst.
- Branchenlandschaft und Wettbewerbsanalyse, einschließlich Marktkonzentration, Heatmap-Analyse, prominenten Akteuren und aktuellen Entwicklungen für den Markt der virtuellen Produktion.
- Detaillierte Firmenprofile.

Ankita ist eine dynamische Marktforschungs- und Beratungsexpertin mit über 8 Jahren Erfahrung in den Bereichen Technologie, Medien, IKT sowie Elektronik und Halbleiter. Sie hat über 100 Beratungs- und Forschungsaufträge für globale Kunden wie Microsoft, Oracle, NEC Corporation, SAP, KPMG und Expeditors International erfolgreich geleitet und durchgeführt. Zu ihren Kernkompetenzen gehören Marktbewertung, Datenanalyse, Prognose, Strategieformulierung, Wettbewerbsbeobachtung und das Verfassen von Berichten. Ankita ist versiert in der Abwicklung kompletter Projektzyklen – von der Angebotserstellung vor dem Verkauf und Kundengesprächen bis hin zur Bereitstellung umsetzbarer Erkenntnisse nach dem Verkauf. Sie ist versiert in der Leitung funktionsübergreifender Teams, der Strukturierung komplexer Forschungsmodule und der Ausrichtung von Lösungen an kundenspezifischen Geschäftszielen. Ihre ausgezeichneten Kommunikationsfähigkeiten, Führungsqualitäten und Präsentationsfähigkeiten haben es ihr ermöglicht, in einem schnelllebigen und sich entwickelnden Marktumfeld stets wertorientierte Ergebnisse zu liefern.
- Historische Analyse (2 Jahre), Basisjahr, Prognose (7 Jahre) mit CAGR
- PEST- und SWOT-Analyse
- Marktgröße Wert/Volumen – Global, Regional, Land
- Branchen- und Wettbewerbslandschaft
- Excel-Datensatz
Erfahrungsberichte
Der SCADA-Systemmarktbericht von Insight Partners ist umfassend und bietet wertvolle Einblicke in aktuelle Trends und Zukunftsprognosen. Das Team war durchweg hochprofessionell, reaktionsschnell und hilfsbereit. Wir sind sehr zufrieden und können die Dienstleistungen wärmstens empfehlen.
RAN KEDEM Partner, Reali Technologies LTDsIch habe einen Bericht über einen sehr spezifischen Softwaremarkt angefordert, und das Team hat ihn innerhalb weniger Tage erstellt. Die Informationen waren sehr relevant und gut präsentiert. Anschließend habe ich einige Änderungen und Ergänzungen zum Bericht angefordert. Das Team reagierte erneut sehr schnell, und ich erhielt den Abschlussbericht in weniger als einer Woche.
JEAN-HERVE JENN Vorsitzende, Future AnalyticaWir haben mit The Insight Partners für eine wichtige Marktstudie und Prognose zusammengearbeitet. Sie gaben uns klare Einblicke in Chancen und Risiken, die uns bei der Gestaltung unserer Pläne halfen. Ihre Recherchen waren benutzerfreundlich und basierten auf soliden Daten. Sie halfen uns, kluge und sichere Entscheidungen zu treffen. Wir können sie wärmstens empfehlen.
PIYUSH NAGPAL Sr. Vizepräsident, Fernlicht GlobalDie Insight Partners lieferten aufschlussreiche, gut strukturierte Marktforschung mit fundierter Fachkompetenz. Ihr Team war durchweg professionell und reaktionsschnell. Die benutzerfreundliche Website ermöglichte den Zugriff auf Branchenberichte. Wir empfehlen sie wärmstens für zuverlässige und hochwertige Forschungsdienstleistungen.
YUKIHIKO ADACHI Geschäftsführer, Deep Blue, LLC.Dies ist das erste Mal, dass ich einen Marktbericht von The Insight Partners erworben habe. Obwohl ich zunächst unsicher war, besuchte ich die Website und fühlte mich dann sicherer, das Risiko einzugehen und einen Marktbericht zu kaufen. Ich bin mit der Qualität des Berichts und dem Kundenservice rundum zufrieden. Ich hatte einige Fragen und Anmerkungen zum ersten Bericht, aber nach einigen E-Mail-Gesprächen mit dem Analysten bin ich überzeugt, dass ich einen Bericht habe, den ich als Input für unseren strategischen Planungsprozess verwenden kann. Vielen Dank, dass Sie sich die Zeit genommen und dies zu einer positiven Erfahrung gemacht haben. Ich werde Ihren Service auf jeden Fall weiterempfehlen und Sie werden meine erste Anlaufstelle sein, wenn wir weitere Marktdaten benötigen.
JOHN SUZUKI Präsident und Chief Executive Officer, Vorstandsmitglied, BK TechnologiesIch möchte mich für Ihre Unterstützung und die Professionalität bedanken, die Sie bei der Bearbeitung meiner Informationsanfrage zum IVD-Markt für Infektionskrankheiten in Nigeria gezeigt haben. Ich schätze Ihre Geduld, Ihre Beratung und die Tatsache, dass Sie bereit waren, einen Rabatt anzubieten, der uns schließlich den Abschluss eines Geschäfts ermöglichte. Ich freue mich darauf, The Insight Partners in Zukunft wieder zu beauftragen, dank des Eindrucks, den Sie bei dieser ersten Begegnung bei mir hinterlassen haben.
DR. CHIJIOKE ONYIA GESCHÄFTSFÜHRERIN, PineCrest Healthcare Ltd.Grund zum Kauf
- Fundierte Entscheidungsfindung
- Marktdynamik verstehen
- Wettbewerbsanalyse
- Kundeneinblicke
- Marktprognosen
- Risikominimierung
- Strategische Planung
- Investitionsbegründung
- Identifizierung neuer Märkte
- Verbesserung von Marketingstrategien
- Steigerung der Betriebseffizienz
- Anpassung an regulatorische Trends


Exklusive Berichtsrabatte freischalten
Jetzt anfragen


 Kostenlose Probe anfordern für - Virtueller Produktionsmarkt