Tela de datos Crecimiento del mercado, tamaño, participación, tendencias, análisis de jugadores clave y pronóstico hasta 2031
Datos históricos : 2021-2022 | Año base : 2023 | Período de pronóstico : 2024-2031Informe de análisis de tamaño y pronóstico del mercado de Data Fabric (2021-2031), participación global y regional, tendencias y oportunidades de crecimiento. Cobertura: por implementación (local y en la nube), componente (software y servicios), solución (descubrimiento de datos, ingesta de datos, orquestación de datos, acceso a datos de Fabric, gestión de datos y administración de Fabric), usuario final (BFSI, TI y telecomunicaciones, comercio minorista, atención médica y farmacéutica, entre otros) y geografía (Norteamérica, Europa, Asia Pacífico, Sudamérica y Centroamérica).
- Estado : Datos publicados
- Código de informe : TIPTE100000792
- Categoría : Tecnología, medios y telecomunicaciones
- Número de páginas : 150
- Formatos de informe disponibles :


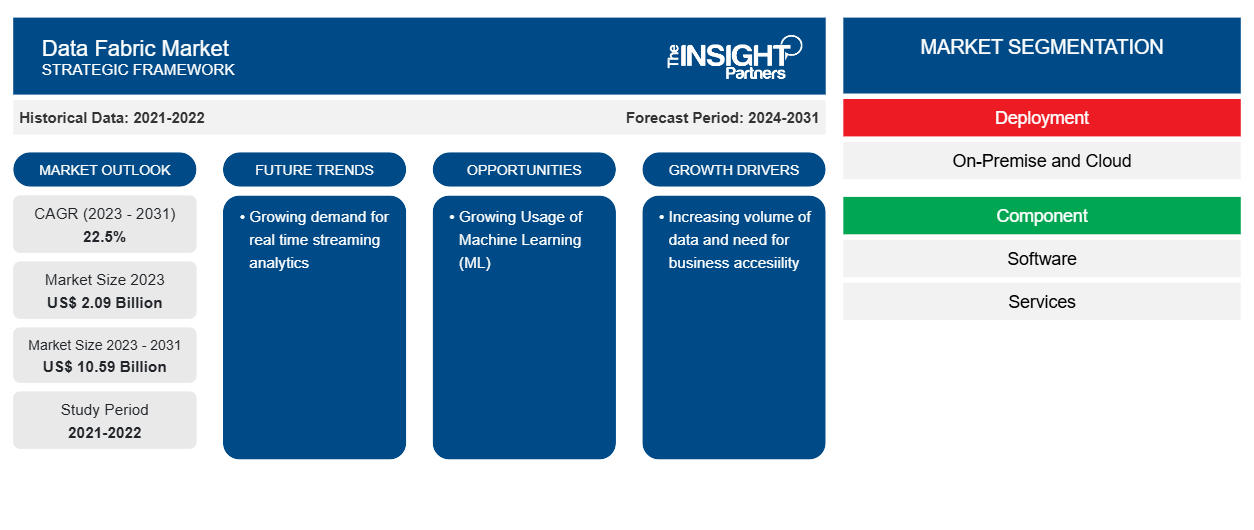
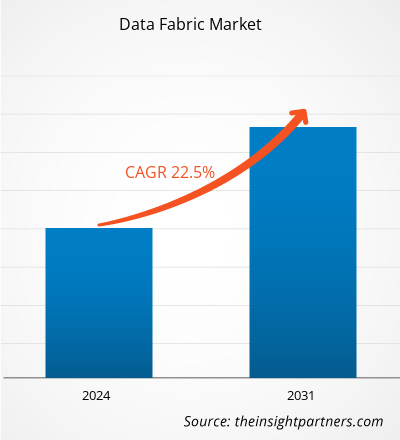
Se proyecta que el mercado de Data Fabric crecerá de 2.090 millones de dólares en 2023 a 10.590 millones de dólares en 2031; se espera que se expanda a una CAGR del 22,5 % entre 2023 y 2031. Se espera que la creciente demanda de análisis de transmisión en tiempo real sea una tendencia clave en el mercado.
Análisis del mercado de Data Fabric
La estructura de datos ofrece virtualización de datos, lo que permite a las empresas implementar un acceso sin inconvenientes a los datos y hacerlos accesibles para todos. Con la implementación de la estructura de datos, los usuarios comerciales pueden acceder a los datos con una participación mínima del departamento de TI, lo que da como resultado un entorno más rápido y sencillo para el acceso y el intercambio de datos. Una estructura de datos lógica bien diseñada centraliza la seguridad esencial y la gestión de datos. Por lo tanto, se espera que el mercado de la estructura de datos crezca durante el período de pronóstico.
Descripción general del mercado de Data Fabric
Data Fabric es un sistema integral de gestión e integración de datos que incluye arquitectura , herramientas de integración y gestión de datos y datos compartidos para ayudar a las empresas a gestionar sus datos. Data Fabric ofrece una experiencia de usuario única y consistente y acceso a los datos en tiempo real para todos los miembros de la red global de una organización. Data Fabric está diseñado para ayudar a las empresas a resolver problemas de datos complejos y casos de uso mediante la gestión de datos en una variedad de aplicaciones, plataformas y ubicaciones. Data Fabric proporciona acceso y uso compartido de datos sin fricciones en un entorno de datos dispersos.
Personalice este informe según sus necesidades
Obtendrá personalización en cualquier informe, sin cargo, incluidas partes de este informe o análisis a nivel de país, paquete de datos de Excel, así como también grandes ofertas y descuentos para empresas emergentes y universidades.
Mercado de Data Fabric: perspectivas estratégicas
-
Obtenga las principales tendencias clave del mercado de este informe.Esta muestra GRATUITA incluirá análisis de datos, desde tendencias del mercado hasta estimaciones y pronósticos.
Factores impulsores del mercado y oportunidades de Data Fabric
Aumento del volumen de datos para favorecer el crecimiento del mercado
Cualquier organización centrada en los datos requiere un enfoque integral que aborde el tiempo, el espacio, los distintos tipos de software y las ubicaciones de los datos. Los datos deben estar disponibles para quienes los necesitan, en lugar de estar ocultos detrás de cortafuegos o dispersos en múltiples lugares. Las empresas necesitan una solución de datos segura, eficiente, consistente y preparada para el futuro para mejorar su eficiencia operativa. Por lo tanto, se espera que la demanda de infraestructura de datos crezca durante el período de pronóstico.
Uso creciente del aprendizaje automático (ML)
Los algoritmos de ML pueden monitorear los flujos de datos y sugerir vínculos e integraciones relevantes . Estos algoritmos extraen información de los datos a medida que está vinculada a la estructura de datos, revisan todos los datos comerciales y encuentran vínculos y correlaciones relevantes. Proporcionar datos es uno de los aspectos que más tiempo consumen en el entrenamiento de un modelo de ML. El diseño de Data Fabric hace que los modelos de ML sean más eficientes al reducir el tiempo de preparación de datos. También mejora la usabilidad de los datos preparados en varias aplicaciones y modelos. Las empresas distribuyen datos en las instalaciones, en la nube y en IoT . La estructura de datos permite un acceso restringido a datos seguros y mejora los procesos de ML. Por lo tanto, se espera que la aplicación de ML en Data Fabric impulse el crecimiento del mercado durante el período de pronóstico.
Tejido de datos
Análisis de segmentación de informes de mercado
Los segmentos clave que contribuyeron a la derivación del análisis del mercado de Data Fabric son la cobertura por implementación, componente, solución y usuario final.
- Por implementación, el mercado se divide en local y en la nube. El segmento de la nube lideró el mercado en 2023.
- Según los componentes, el mercado se divide en software y servicios.
- Según la solución, el mercado se divide en descubrimiento de datos, ingesta de datos, orquestación de datos, acceso a datos de la estructura, gestión de datos y gestión y administración de la estructura.
- Sobre la base de los usuarios finales, el mercado se divide en BFSI, TI y telecomunicaciones, comercio minorista, atención médica y productos farmacéuticos , y otros.
Análisis de la cuota de mercado de Data Fabric por geografía
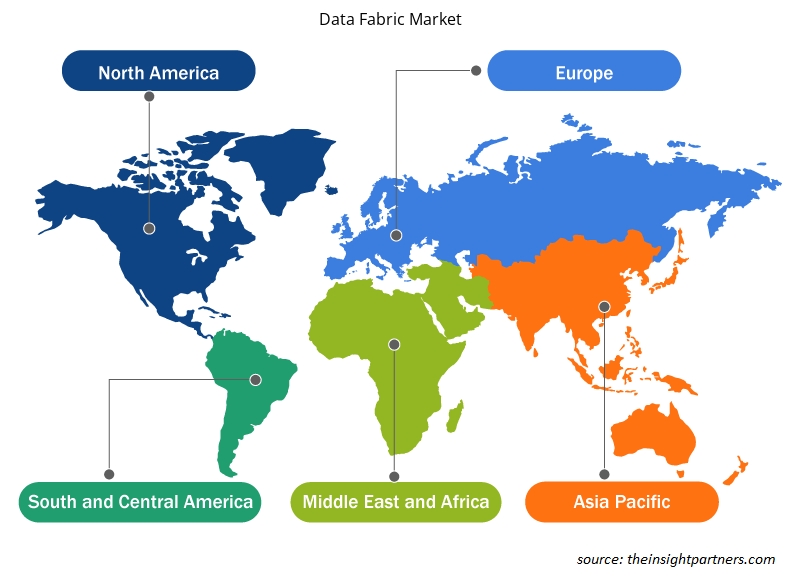
Según la región, el mercado está segmentado en América del Norte, Europa, Asia Pacífico, Medio Oriente y África, y América del Sur y Central.
La región de América del Norte tuvo una participación destacada en el mercado de Data Fabric en 2023 y se espera que crezca a una CAGR sustancial durante el período de pronóstico. Este crecimiento puede atribuirse a la presencia de numerosos participantes del mercado y a la adopción temprana de la tecnología. Además, se espera que la región de Asia Pacífico crezca a la CAGR más rápida durante el período de pronóstico. Este crecimiento puede atribuirse al creciente número de centros de datos y a la creciente digitalización.
Perspectivas regionales del mercado de Data Fabric
Los analistas de Insight Partners explicaron en detalle las tendencias y los factores regionales que influyen en el mercado de Data Fabric durante el período de pronóstico. Esta sección también analiza los segmentos y la geografía del mercado de Data Fabric en América del Norte, Europa, Asia Pacífico, Oriente Medio y África, y América del Sur y Central.
- Obtenga datos regionales específicos para el mercado de Data Fabric
Alcance del informe de mercado de Data Fabric
| Atributo del informe | Detalles |
|---|---|
| Tamaño del mercado en 2023 | US$ 2.09 mil millones |
| Tamaño del mercado en 2031 | US$ 10,59 mil millones |
| CAGR global (2023 - 2031) | 22,5% |
| Datos históricos | 2021-2022 |
| Período de pronóstico | 2024-2031 |
| Segmentos cubiertos |
Por implementación
|
| Regiones y países cubiertos |
América del norte
|
| Líderes del mercado y perfiles de empresas clave |
|
Densidad de actores del mercado: comprensión de su impacto en la dinámica empresarial
El mercado de Data Fabric está creciendo rápidamente, impulsado por la creciente demanda de los usuarios finales debido a factores como la evolución de las preferencias de los consumidores, los avances tecnológicos y una mayor conciencia de los beneficios del producto. A medida que aumenta la demanda, las empresas amplían sus ofertas, innovan para satisfacer las necesidades de los consumidores y aprovechan las tendencias emergentes, lo que impulsa aún más el crecimiento del mercado.
La densidad de actores del mercado se refiere a la distribución de las empresas o firmas que operan dentro de un mercado o industria en particular. Indica cuántos competidores (actores del mercado) están presentes en un espacio de mercado determinado en relación con su tamaño o valor total de mercado.
Las principales empresas que operan en el mercado de Data Fabric son:
- Tecnologías Denodo
- Corporación IBM
- Corporación Informatica
- Vista K2
- Empresa: NetApp.
- Corporación Oracle
Descargo de responsabilidad : Las empresas enumeradas anteriormente no están clasificadas en ningún orden particular.
- Obtenga una descripción general de los principales actores clave del mercado de Data Fabric
Noticias y desarrollos recientes del mercado de Data Fabric
El mercado de Data Fabric se evalúa mediante la recopilación de datos cualitativos y cuantitativos a partir de investigaciones primarias y secundarias, que incluyen importantes publicaciones corporativas, datos de asociaciones y bases de datos. A continuación, se enumeran algunos de los avances en el mercado de Data Fabric:
- LigaData, un proveedor líder en el panorama de la tecnología de telecomunicaciones, está revolucionando la industria del análisis de datos de telecomunicaciones con el lanzamiento de su nuevo LigaData Telecom Data Fabric 4.0 y LigaData Telecom AI Apps. Estos nuevos productos permiten a las empresas de telecomunicaciones y proveedores de servicios de comunicaciones transformar sus negocios de ser empresas de telecomunicaciones tradicionales en empresas tecnológicas ágiles basadas en datos e inteligencia artificial, al tiempo que impulsan el crecimiento de los ingresos, conservan la participación de mercado y mejoran la experiencia del cliente. (Fuente: LigaData, comunicado de prensa, febrero de 2024)
Informe de mercado de Data Fabric: cobertura y resultados
El pronóstico del mercado de Data Fabric se estima en función de varios hallazgos de investigación primaria y secundaria, como publicaciones de empresas clave, datos de asociaciones y bases de datos. El informe de mercado "Tamaño y pronóstico del mercado de Data Fabric (2021-2031)" proporciona un análisis detallado del mercado que cubre las siguientes áreas:
- Tamaño del mercado de Data Fabric y pronóstico a nivel global, regional y nacional para todos los segmentos clave del mercado cubiertos bajo el alcance
- Tendencias del mercado de Data Fabric, así como dinámicas del mercado, como impulsores, restricciones y oportunidades clave
- Análisis detallado de las cinco fuerzas de Porter y PEST y FODA
- Análisis del mercado de Data Fabric que cubre las tendencias clave del mercado, el marco global y regional, los principales actores, las regulaciones y los desarrollos recientes del mercado
- Panorama de la industria y análisis de la competencia que abarca la concentración del mercado, análisis de mapas de calor, actores destacados y desarrollos recientes en el mercado de Data Fabric
- Perfiles detallados de empresas.

Ankita es una profesional dinámica en investigación de mercados y consultoría con más de 8 años de experiencia en los sectores de tecnología, medios de comunicación, TIC, electrónica y semiconductores. Ha liderado y ejecutado con éxito más de 100 proyectos de consultoría e investigación para clientes globales como Microsoft, Oracle, NEC Corporation, SAP, KPMG y Expeditors International. Sus principales competencias incluyen la evaluación de mercado, el análisis de datos, la previsión, la formulación de estrategias, la inteligencia competitiva y la redacción de informes.
Ankita es experta en la gestión de ciclos completos de proyecto, desde el diseño de propuestas de preventa y las conversaciones con los clientes hasta la entrega de información práctica posventa. Es experta en la gestión de equipos multifuncionales, la estructuración de módulos de investigación complejos y la alineación de soluciones con los objetivos de negocio específicos del cliente. Sus excelentes habilidades de comunicación, liderazgo y presentación le han permitido obtener constantemente resultados orientados al valor en entornos de mercado dinámicos y en constante evolución.
- Análisis histórico (2 años), año base, pronóstico (7 años) con CAGR
- Análisis PEST y FODA
- Tamaño del mercado, valor/volumen: global, regional y nacional
- Industria y panorama competitivo
- Conjunto de datos de Excel
Testimonios
El informe de mercado de sistemas SCADA de Insight Partners es completo y ofrece información valiosa sobre las tendencias actuales y las previsiones futuras. El equipo fue altamente profesional, receptivo y me brindó un gran apoyo en todo momento. Estamos muy satisfechos y recomendamos ampliamente sus servicios.
RAN KEDEM Socio, Reali Technologies LTDsSolicité un informe sobre un mercado de software muy específico y el equipo lo elaboró en pocos días. La información era muy relevante y estaba bien presentada. Posteriormente, solicité algunos cambios y adiciones al informe. El equipo fue muy receptivo y recibí el informe final en menos de una semana.
JEAN-HERVE JENN Presidente, Future AnalyticaTrabajamos con The Insight Partners para un importante estudio y pronóstico de mercado. Nos brindaron una visión clara de las oportunidades y los riesgos, lo que nos ayudó a definir nuestros planes. Su investigación fue fácil de usar y se basó en datos sólidos. Nos ayudó a tomar decisiones inteligentes y seguras. Los recomendamos ampliamente.
PIYUSH NAGPAL Vicepresidente Sénior, , High Beam GlobalThe Insight Partners realizó una investigación de mercado profunda y bien estructurada con una sólida experiencia en el sector. Su equipo fue profesional y receptivo en todo momento. El sitio web, fácil de usar, facilitó el acceso a los informes del sector. Los recomendamos ampliamente por sus servicios de investigación confiables y de alta calidad.
YUKIHIKO ADACHI Director Ejecutivo, , Deep Blue, LLCEsta es la primera vez que compro un informe de mercado de The Insight Partners. Aunque al principio tenía dudas, visité su sitio web y me sentí más cómodo al arriesgarme y comprarlo. Estoy completamente satisfecho con la calidad del informe y el servicio al cliente. Tenía varias preguntas y comentarios sobre el informe inicial, pero después de un par de conversaciones por correo electrónico con su analista, creo que tengo un informe que puedo usar como base para nuestro proceso de planificación estratégica. Muchas gracias por tomarse el tiempo y hacer de esta una experiencia positiva. Sin duda, recomendaré sus servicios y serán mi primera opción cuando necesitemos más datos de mercado.
JOHN SUZUKI Presidente y Director Ejecutivo, Director de la Junta Directiva, BK TechnologiesAgradezco su apoyo y la profesionalidad que demostraron al atender mi solicitud de información sobre el mercado de diagnóstico in vitro (IVD) para enfermedades infecciosas en Nigeria. Agradezco su paciencia, su orientación y su disposición a ofrecerme un descuento, lo que finalmente nos permitió cerrar un trato. Espero poder colaborar con The Insight Partners en el futuro, gracias a la impresión que me causó este primer encuentro.
DRA. CHIJIOKE ONYIA, DIRECTORA GENERAL, PineCrest Healthcare Ltd.Razón para comprar
- Toma de decisiones informada
- Comprensión de la dinámica del mercado
- Análisis competitivo
- Información sobre clientes
- Pronósticos del mercado
- Mitigación de riesgos
- Planificación estratégica
- Justificación de la inversión
- Identificación de mercados emergentes
- Mejora de las estrategias de marketing
- Impulso de la eficiencia operativa
- Alineación con las tendencias regulatorias


Desbloquea descuentos exclusivos en informes
Consultar ahora


 Obtenga una muestra gratuita para - Mercado de Data Fabric