Pronóstico del mercado de soluciones de gestión de liquidez y activos y pasivos (2026-2034)
Datos históricos : 2021-2024 | Año base : 2025 | Período de pronóstico : 2026-2034Tamaño y pronóstico del mercado de soluciones de gestión de liquidez y activos y pasivos (2021-2034), análisis de participación global y regional, tendencias y oportunidades de crecimiento. Cobertura del informe: por componente (soluciones y servicios) e industria (bancos, corredores, finanzas especializadas, asesores patrimoniales, etc.).
- Estado : Datos publicados
- Código de informe : TIPRE00017757
- Categoría : Tecnología, medios y telecomunicaciones
- Número de páginas : 150
- Formatos de informe disponibles :


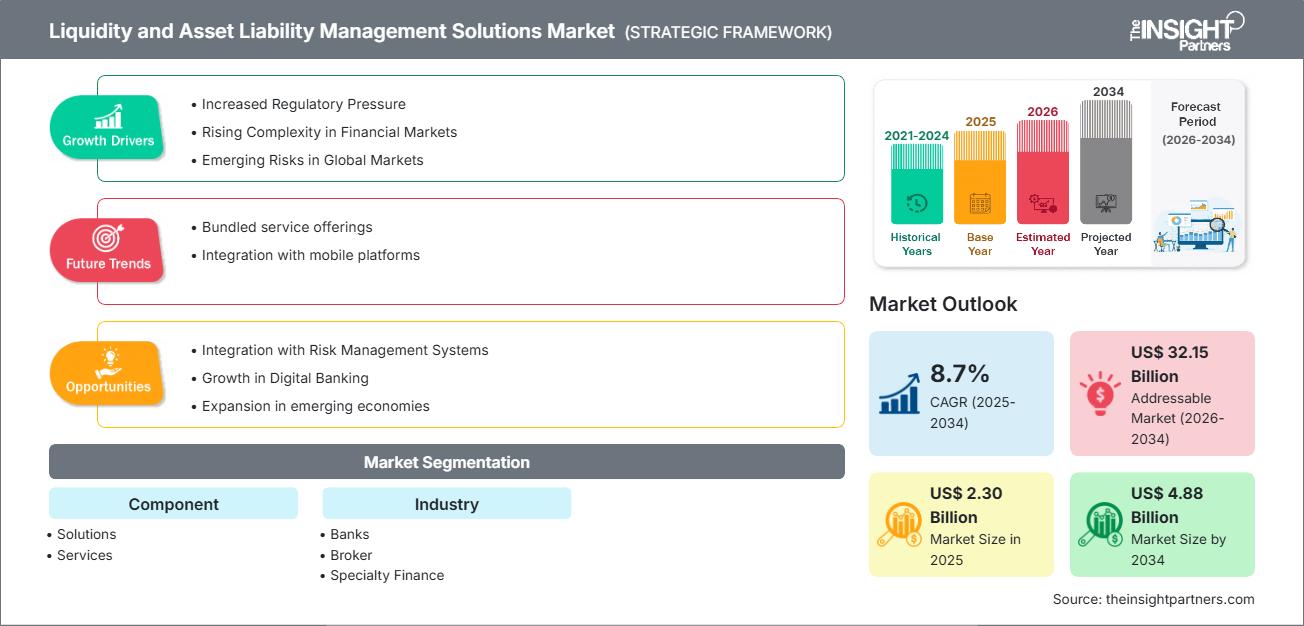
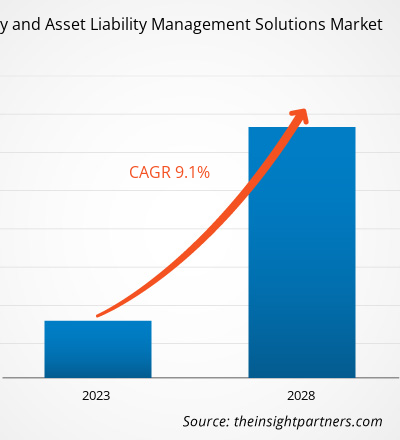
Se proyecta que el mercado de soluciones de gestión de activos y pasivos (ALM) crezca de US$ 2.300 millones en 2025 a US$ 4.880 millones en 2034, a una CAGR del 8,7% durante el período de pronóstico.
Análisis del mercado de soluciones de gestión de liquidez y activos y pasivos
El aumento del riesgo crediticio en las instituciones financieras y la creciente presión regulatoria sobre el riesgo de tasas de interés impulsan el mercado de soluciones de liquidez y ALM. Los bancos y otras instituciones financieras utilizan este tipo de solución para realizar análisis de escenarios, gestionar sus balances con mayor eficacia y cumplir con los mayores requisitos de capital y financiación. Las soluciones ALM avanzadas incluyen un módulo FTP que permite a la institución calcular la rentabilidad en los distintos niveles del negocio.
La mayor volatilidad de las tasas de interés a nivel mundial, por ejemplo en Estados Unidos, el Reino Unido y Japón, ha incrementado la presión sobre los márgenes de interés netos, lo que hace que una gestión eficaz de los activos y pasivos sea de suma importancia.
Descripción general del mercado de soluciones de gestión de liquidez y activos y pasivos
La gestión de liquidez se refiere a garantizar suficiente efectivo y activos líquidos para cumplir con las obligaciones. Por el contrario, la gestión de activos y pasivos implica alinear los vencimientos, las tasas y los volúmenes de activos y pasivos para minimizar el riesgo y optimizar la rentabilidad.
Las soluciones de liquidez y ALM ayudan a las instituciones financieras a modelar y controlar estas dinámicas de manera eficiente, lo que permite la toma de decisiones basada en riesgos, la previsión, el cumplimiento normativo y la optimización del rendimiento.
Personalice este informe según sus necesidades
Obtendrá personalización en cualquier informe, sin cargo, incluidas partes de este informe o análisis a nivel de país, paquete de datos de Excel, así como también grandes ofertas y descuentos para empresas emergentes y universidades.
Mercado de soluciones de gestión de liquidez y activos y pasivos: Perspectivas estratégicas
-
Obtenga las principales tendencias clave del mercado de este informe.Esta muestra GRATUITA incluirá análisis de datos, desde tendencias del mercado hasta estimaciones y pronósticos.
Soluciones de gestión de liquidez y activos y pasivos: impulsores y oportunidades del mercado
Factores impulsores del mercado:
- Aumento del riesgo crediticio en las instituciones financieras: el aumento de los incumplimientos, las carteras de préstamos estresadas y los entornos macroeconómicos inciertos empujan a las instituciones a adoptar soluciones para gestionar el riesgo de liquidez y de tipos de interés.
- Presiones regulatorias: La mayoría de las regulaciones, incluyendo el IRRBB o Riesgo de Tasa de Interés en la Cartera Bancaria, las pruebas de estrés para la planificación del financiamiento y los marcos de riesgo de capital, obligan a los bancos a ejecutar modelos ALM elaborados.
- Entorno de tasas de interés volátiles: la volatilidad de las tasas globales comprime los márgenes y, por lo tanto, aumenta la necesidad de una gestión de activos y pasivos eficaz para salvaguardar la rentabilidad.
- Digitalización y analítica: Las instituciones basan cada vez más su toma de decisiones en el análisis de datos, la simulación de escenarios y la previsión en ALM.
Oportunidades:
- IA/aprendizaje automático para modelado de riesgos: las herramientas ALM avanzadas impulsadas por IA pueden mejorar la previsión, las pruebas de estrés de liquidez y la gestión de escenarios.
- Plataformas ALM basadas en la nube: la implementación de la nube puede ayudar a las instituciones a escalar los sistemas ALM de manera más flexible y, al mismo tiempo, reducir los costos de infraestructura.
- Integración con sistemas de tesorería: las herramientas ALM se pueden integrar con sistemas de tesorería, riesgo y precios de transferencia de fondos para crear un marco de decisión unificado.
- Expansión en mercados emergentes: A medida que los bancos en las economías emergentes (por ejemplo, Asia Pacífico) crecen, su necesidad de soluciones avanzadas de liquidez y ALM está aumentando.
Análisis de segmentación del informe de mercado de soluciones de gestión de activos y pasivos
Por componente:
- Soluciones
- Servicios
Por tipo de industria/institución:
- bancos
- Corredores
- Finanzas especializadas
- Asesores patrimoniales
- Otros
Por geografía:
- América del norte
- Europa
- Asia-Pacífico
- América del Sur y Central
- Oriente Medio y África
Perspectivas regionales del mercado de soluciones de gestión de activos y pasivos
Los analistas de The Insight Partners han explicado detalladamente las tendencias y los factores regionales que influyen en el mercado de soluciones de gestión de liquidez y activos y pasivos durante el período de pronóstico. Esta sección también analiza los segmentos y la geografía del mercado de soluciones de gestión de liquidez y activos y pasivos en América del Norte, Europa, Asia Pacífico, Oriente Medio y África, y América del Sur y Central.
Alcance del informe de mercado de soluciones de gestión de activos y pasivos
| Atributo del informe | Detalles |
|---|---|
| Tamaño del mercado en 2025 | US$ 2.30 mil millones |
| Tamaño del mercado en 2034 | US$ 4.88 mil millones |
| CAGR global (2025-2034) | 8,7% |
| Datos históricos | 2021-2024 |
| Período de pronóstico | 2026-2034 |
| Segmentos cubiertos |
Por componente
|
| Regiones y países cubiertos |
América del norte
|
| Líderes del mercado y perfiles de empresas clave |
|
Soluciones de gestión de liquidez y activos y pasivos: Densidad de actores del mercado: Comprensión de su impacto en la dinámica empresarial
El mercado de soluciones de gestión de liquidez y activos y pasivos está creciendo rápidamente, impulsado por la creciente demanda de los usuarios finales debido a factores como la evolución de las preferencias de los consumidores, los avances tecnológicos y un mayor conocimiento de los beneficios del producto. A medida que aumenta la demanda, las empresas amplían su oferta, innovan para satisfacer las necesidades de los consumidores y aprovechan las tendencias emergentes, lo que impulsa aún más el crecimiento del mercado.
- Obtenga una descripción general de los principales actores del mercado de soluciones de gestión de activos y pasivos de liquidez.
Análisis de la cuota de mercado de soluciones de gestión de liquidez y activos y pasivos por geografía
- América del Norte: Fuerte adopción impulsada por una infraestructura bancaria avanzada, sofisticación regulatoria y demanda de plataformas integradas de gestión de riesgos.
- Europa: Las exigencias regulatorias y las instituciones financieras sofisticadas impulsan la adopción de ALM; las pruebas de estrés y los mandatos de riesgo de tasa de interés son clave.
- Asia Pacífico: Se prevé una región de rápido crecimiento. El creciente tamaño del sector bancario, la transformación digital y la concienciación sobre el riesgo impulsan la demanda de ALM.
- América del Sur y Central: Mercado emergente para ALM, impulsado por las necesidades de gestión de riesgos en sectores bancarios en crecimiento.
- Medio Oriente y África: la creciente adopción de servicios financieros y la maduración regulatoria presentan oportunidades para los proveedores de soluciones ALM.
Soluciones de gestión de liquidez y activos y pasivos: Densidad de actores del mercado: Comprensión de su impacto en la dinámica empresarial
La competencia se intensifica en el mercado de soluciones de liquidez y ALM. Entre los actores clave se incluyen grandes firmas globales de software financiero, así como especialistas regionales. Para diferenciarse, los proveedores son:
- Ofrecemos plataformas integradas de ALM + riesgo de liquidez con FTP, análisis de escenarios y pruebas de estrés.
- Incorporando análisis, inteligencia artificial y modelos predictivos para proporcionar información prospectiva sobre riesgos.
- Proporcionar servicios ALM basados en la nube para reducir los costos de adopción y mejorar la escalabilidad.
- Asociación con bancos e instituciones financieras para personalizar los sistemas ALM en función de las necesidades regulatorias y del mercado local.
Principales empresas que operan en el mercado de soluciones de liquidez y ALM:
- Experian Information Software, Inc.
- Servicios de información nacional de Fidelity, Inc.
- Finastra International Limited
- Corporación IBM
- Infosys, Ltd.
- Intellect Design Arena Limited
- Corporación Moody's
- Corporación Oracle
- SAP SE
Otras empresas analizadas durante la investigación
- FIS Global
- Instituto SAS, Inc.
- Fiserv, Inc.
- Accenture PLC
- KPMG LLP
- Deloitte
- PwC
- EY
- Protiviti, Inc.
- Álvarez y Marsal
Noticias del mercado y desarrollos recientes de soluciones de gestión de liquidez y activos y pasivos
- Iniciativas de transformación digital: Las instituciones financieras utilizan cada vez más análisis en tiempo real, ALM en la nube y herramientas impulsadas por IA para mejorar la previsión de liquidez y la gestión de riesgos.
- Exigencias de pruebas de estrés regulatorias: con una regulación de capital y liquidez más estricta en todo el mundo, los bancos están invirtiendo más en sistemas ALM que respalden las pruebas de estrés regulatorias, el riesgo de tasa de interés en la cartera bancaria (IRRBB) y los precios de transferencia de fondos.
- Asociaciones e implementaciones: por ejemplo, en junio de 2022, Infosys Finacle (EdgeVerve) implementó sus plataformas de tesorería y ALM con un banco, mostrando la implementación de sistemas integrados de riesgo y liquidez.
Informe de mercado sobre soluciones de gestión de activos y pasivos: cobertura y resultados
El informe "Tamaño y pronóstico del mercado de soluciones de gestión de liquidez y activos y pasivos (2021-2034)" de The Insight Partners incluye:
- Tamaño del mercado a nivel global, regional y nacional y pronósticos para todos los segmentos clave
- Dinámica detallada del mercado: impulsores, restricciones y oportunidades
- Análisis PEST y FODA
- Perspectivas estratégicas: tendencias, impactos regulatorios y análisis competitivo
- Panorama de la industria: concentración del mercado, mapa de calor de los actores clave, movimientos estratégicos recientes
- Perfiles detallados de empresas proveedoras de soluciones ALM líderes y emergentes

Ankita es una profesional dinámica en investigación de mercados y consultoría con más de 8 años de experiencia en los sectores de tecnología, medios de comunicación, TIC, electrónica y semiconductores. Ha liderado y ejecutado con éxito más de 100 proyectos de consultoría e investigación para clientes globales como Microsoft, Oracle, NEC Corporation, SAP, KPMG y Expeditors International. Sus principales competencias incluyen la evaluación de mercado, el análisis de datos, la previsión, la formulación de estrategias, la inteligencia competitiva y la redacción de informes.
Ankita es experta en la gestión de ciclos completos de proyecto, desde el diseño de propuestas de preventa y las conversaciones con los clientes hasta la entrega de información práctica posventa. Es experta en la gestión de equipos multifuncionales, la estructuración de módulos de investigación complejos y la alineación de soluciones con los objetivos de negocio específicos del cliente. Sus excelentes habilidades de comunicación, liderazgo y presentación le han permitido obtener constantemente resultados orientados al valor en entornos de mercado dinámicos y en constante evolución.
- Análisis histórico (2 años), año base, pronóstico (7 años) con CAGR
- Análisis PEST y FODA
- Tamaño del mercado, valor/volumen: global, regional y nacional
- Industria y panorama competitivo
- Conjunto de datos de Excel
Testimonios
El informe de mercado de sistemas SCADA de Insight Partners es completo y ofrece información valiosa sobre las tendencias actuales y las previsiones futuras. El equipo fue altamente profesional, receptivo y me brindó un gran apoyo en todo momento. Estamos muy satisfechos y recomendamos ampliamente sus servicios.
RAN KEDEM Socio, Reali Technologies LTDsSolicité un informe sobre un mercado de software muy específico y el equipo lo elaboró en pocos días. La información era muy relevante y estaba bien presentada. Posteriormente, solicité algunos cambios y adiciones al informe. El equipo fue muy receptivo y recibí el informe final en menos de una semana.
JEAN-HERVE JENN Presidente, Future AnalyticaTrabajamos con The Insight Partners para un importante estudio y pronóstico de mercado. Nos brindaron una visión clara de las oportunidades y los riesgos, lo que nos ayudó a definir nuestros planes. Su investigación fue fácil de usar y se basó en datos sólidos. Nos ayudó a tomar decisiones inteligentes y seguras. Los recomendamos ampliamente.
PIYUSH NAGPAL Vicepresidente Sénior, , High Beam GlobalThe Insight Partners realizó una investigación de mercado profunda y bien estructurada con una sólida experiencia en el sector. Su equipo fue profesional y receptivo en todo momento. El sitio web, fácil de usar, facilitó el acceso a los informes del sector. Los recomendamos ampliamente por sus servicios de investigación confiables y de alta calidad.
YUKIHIKO ADACHI Director Ejecutivo, , Deep Blue, LLCEsta es la primera vez que compro un informe de mercado de The Insight Partners. Aunque al principio tenía dudas, visité su sitio web y me sentí más cómodo al arriesgarme y comprarlo. Estoy completamente satisfecho con la calidad del informe y el servicio al cliente. Tenía varias preguntas y comentarios sobre el informe inicial, pero después de un par de conversaciones por correo electrónico con su analista, creo que tengo un informe que puedo usar como base para nuestro proceso de planificación estratégica. Muchas gracias por tomarse el tiempo y hacer de esta una experiencia positiva. Sin duda, recomendaré sus servicios y serán mi primera opción cuando necesitemos más datos de mercado.
JOHN SUZUKI Presidente y Director Ejecutivo, Director de la Junta Directiva, BK TechnologiesAgradezco su apoyo y la profesionalidad que demostraron al atender mi solicitud de información sobre el mercado de diagnóstico in vitro (IVD) para enfermedades infecciosas en Nigeria. Agradezco su paciencia, su orientación y su disposición a ofrecerme un descuento, lo que finalmente nos permitió cerrar un trato. Espero poder colaborar con The Insight Partners en el futuro, gracias a la impresión que me causó este primer encuentro.
DRA. CHIJIOKE ONYIA, DIRECTORA GENERAL, PineCrest Healthcare Ltd.Razón para comprar
- Toma de decisiones informada
- Comprensión de la dinámica del mercado
- Análisis competitivo
- Información sobre clientes
- Pronósticos del mercado
- Mitigación de riesgos
- Planificación estratégica
- Justificación de la inversión
- Identificación de mercados emergentes
- Mejora de las estrategias de marketing
- Impulso de la eficiencia operativa
- Alineación con las tendencias regulatorias


Desbloquea descuentos exclusivos en informes
Consultar ahora


 Obtenga una muestra gratuita para - Mercado de soluciones de gestión de liquidez y activos y pasivos