
Mercado de soluciones de disponibilidad en el lineal: mapeo competitivo y perspectivas estratégicas para 2031
Tamaño y pronóstico del mercado de soluciones de disponibilidad en el mercado (2021-2031), participación global y regional, tendencias y análisis de oportunidades de crecimiento. Cobertura del informe: por componente (solución y servicios), implementación (nube y local), usuario final (fabricantes de CPG, minoristas, proveedores y otros) y geografía.
- Estado : Datos publicados
- Código de informe : TIPRE00007761
- Categoría : Tecnología, medios y telecomunicaciones
- Número de páginas : 150
- Formatos de informe disponibles :


- Fecha de última actualización : October 24, 2024

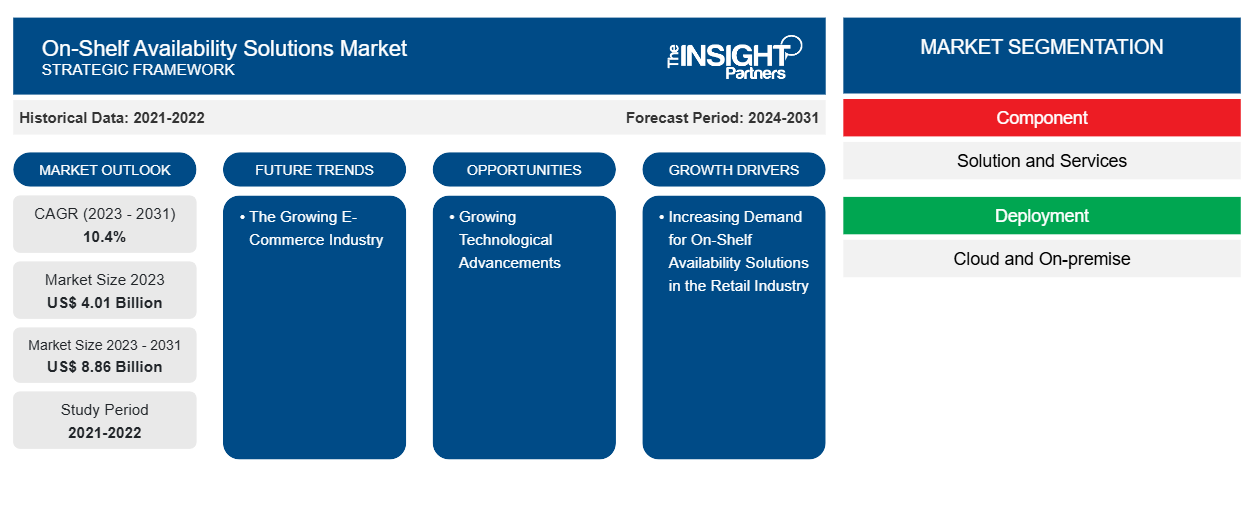
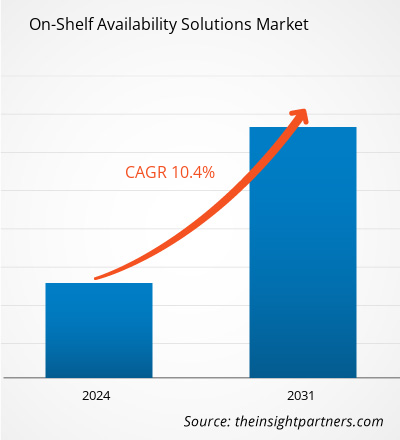
Se proyecta que el tamaño del mercado de soluciones de disponibilidad en las estanterías alcance los 8.860 millones de dólares estadounidenses en 2031, frente a los 4.010 millones de dólares estadounidenses en 2023. Se espera que el mercado registre una CAGR del 10,4 % entre 2023 y 2031. Es probable que la creciente industria del comercio electrónico siga siendo una tendencia clave en el mercado de soluciones de disponibilidad en las estanterías.
Análisis del mercado de soluciones de disponibilidad en el mercado
El creciente número de tiendas minoristas en todo el mundo está aumentando la demanda de soluciones de disponibilidad en las estanterías en la industria minorista, que es uno de los principales factores que impulsan el crecimiento del mercado. Además, la creciente demanda de soluciones omnicanal y el enfoque creciente en la experiencia del cliente están impulsando el crecimiento del mercado. Además, la creciente integración de tecnología avanzada como IA, ML, visión artificial y otras está creando una oportunidad para el crecimiento del mercado de soluciones de disponibilidad en las estanterías en los próximos años.
Descripción general del mercado de soluciones de disponibilidad en el mercado
La disponibilidad en las estanterías se refiere a la presencia de un producto en las estanterías de una tienda cuando un cliente llega para comprarlo. La disponibilidad en las estanterías garantiza que los clientes puedan comprar el producto que desean de forma fácil y sin problemas. Para el minorista, garantiza la satisfacción del consumidor, así como mayores ingresos por las ventas de productos. La disponibilidad en las estanterías también ayuda a los fabricantes, ya que garantiza las ventas de sus productos y ofrece información útil para el control de inventario. Como resultado, en el sector minorista, la disponibilidad en las estanterías es un factor crucial que debe controlarse y mantenerse de manera eficaz.
Personalice este informe según sus necesidades
Obtendrá personalización en cualquier informe, sin cargo, incluidas partes de este informe o análisis a nivel de país, paquete de datos de Excel, así como también grandes ofertas y descuentos para empresas emergentes y universidades.
Mercado de soluciones de disponibilidad en anaquel: perspectivas estratégicas
-
Obtenga las principales tendencias clave del mercado de este informe.Esta muestra GRATUITA incluirá análisis de datos, desde tendencias del mercado hasta estimaciones y pronósticos.
Impulsores y oportunidades del mercado de soluciones de disponibilidad en el mercado
Demanda creciente de soluciones de disponibilidad en los estantes en el sector minorista
Los aspectos fundamentales de las operaciones de las tiendas siguen siendo un desafío para muchos minoristas, con frecuencia porque no pueden interpretar los datos que tienen o no tienen acceso a la información necesaria para realizar mejoras. Para abordar este problema, los minoristas están adoptando soluciones de disponibilidad en las estanterías. Esta solución puede ayudar a los minoristas a brindar satisfacción al cliente y aumentar los ingresos a través de la venta del producto. Además, ayuda a los minoristas a mejorar la reputación de la marca y fomentar una cultura empresarial más positiva. Por lo tanto, todos los factores anteriores están aumentando la demanda de soluciones de disponibilidad en las estanterías en la industria minorista, lo que impulsa el crecimiento del mercado.
Crecientes avances tecnológicos
La gestión manual de estanterías requiere altos costes de mano de obra y, en la mayoría de los casos, se lleva a cabo con una frecuencia definida. Para resolver este problema, varios actores del mercado trabajan continuamente en la integración de tecnologías avanzadas como la IA , la visión artificial y otras. La integración de las tecnologías puede ayudar a detectar automáticamente los artículos OOS, las colocaciones incorrectas y otros problemas mediante la identificación, clasificación e inventario de los artículos de las estanterías mediante algoritmos como el reconocimiento de etiquetas de precio, el reconocimiento de productos, la detección de OOS, el reconocimiento de actividades y el reconocimiento óptico de caracteres (OCR). Por lo tanto, estos avances tecnológicos pueden crear una oportunidad para el crecimiento del mercado en el período previsto.
Análisis de segmentación del informe de mercado de soluciones de disponibilidad en el estante
Los segmentos clave que contribuyeron a la derivación del análisis del mercado de soluciones de disponibilidad en existencia son los componentes, la implementación y el usuario final.
- Según los componentes, el mercado se divide en soluciones y servicios. El segmento de soluciones tuvo una mayor participación de mercado en 2023.
- Por implementación, el mercado se segmenta en nube y local. El segmento de la nube tuvo la mayor participación del mercado en 2023.
- Por usuario final, el mercado está segmentado en fabricantes de CPG, minoristas, proveedores y otros. El segmento de fabricantes de CPG tuvo la mayor participación del mercado en 2023.
Análisis de la cuota de mercado de soluciones de disponibilidad en el mercado por geografía
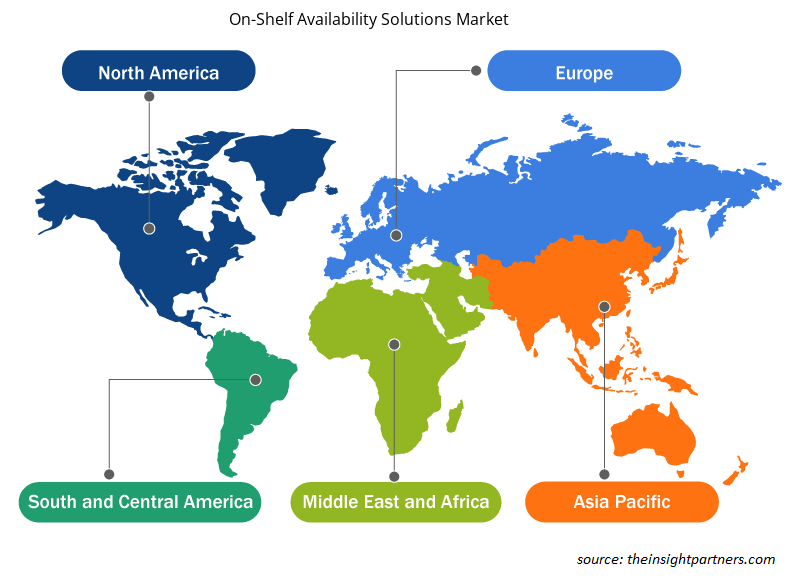
El alcance geográfico del informe de mercado de soluciones de disponibilidad en el mercado se divide principalmente en cinco regiones: América del Norte, Asia Pacífico, Europa, Medio Oriente y África, y América del Sur/América del Sur y Central.
En términos de ingresos, América del Norte representó la mayor participación de mercado en soluciones de disponibilidad en anaquel. El mercado en esta región está segmentado en Estados Unidos, Canadá y México. La región está presenciando un tremendo aumento en su sector de comercio electrónico, que es uno de los principales factores que impulsan el crecimiento del mercado. Además, la región consta de sectores minoristas y de cadena de suministro altamente desarrollados, lo que contribuye aún más al aumento de la demanda de soluciones de disponibilidad en anaquel en América del Norte.
Perspectivas regionales del mercado de soluciones de disponibilidad en el mercado
Los analistas de Insight Partners explicaron en detalle las tendencias y los factores regionales que influyen en el mercado de soluciones de disponibilidad en estantería durante el período de pronóstico. Esta sección también analiza los segmentos y la geografía del mercado de soluciones de disponibilidad en estantería en América del Norte, Europa, Asia Pacífico, Oriente Medio y África, y América del Sur y Central.
- Obtenga datos regionales específicos para el mercado de soluciones de disponibilidad en el mercado
Alcance del informe de mercado de soluciones de disponibilidad en el mercado
| Atributo del informe | Detalles |
|---|---|
| Tamaño del mercado en 2023 | US$ 4.01 mil millones |
| Tamaño del mercado en 2031 | US$ 8.86 mil millones |
| CAGR global (2023 - 2031) | 10,4% |
| Datos históricos | 2021-2022 |
| Período de pronóstico | 2024-2031 |
| Segmentos cubiertos |
Por componente
|
| Regiones y países cubiertos |
América del norte
|
| Líderes del mercado y perfiles de empresas clave |
|
Densidad de actores del mercado de soluciones de disponibilidad en anaquel: comprensión de su impacto en la dinámica empresarial
El mercado de soluciones de disponibilidad en las estanterías está creciendo rápidamente, impulsado por la creciente demanda de los usuarios finales debido a factores como la evolución de las preferencias de los consumidores, los avances tecnológicos y una mayor conciencia de los beneficios del producto. A medida que aumenta la demanda, las empresas amplían sus ofertas, innovan para satisfacer las necesidades de los consumidores y aprovechan las tendencias emergentes, lo que impulsa aún más el crecimiento del mercado.
La densidad de actores del mercado se refiere a la distribución de las empresas o firmas que operan dentro de un mercado o industria en particular. Indica cuántos competidores (actores del mercado) están presentes en un espacio de mercado determinado en relación con su tamaño o valor total de mercado.
Las principales empresas que operan en el mercado de soluciones de disponibilidad en estantería son:
- Grupo Tecnológico Atlas
- Compañía: BeMyEye Holdings Ltd.
- Corporación IBM
- Soluciones para el comercio minorista
- Cª
- SAP SE
Descargo de responsabilidad : Las empresas enumeradas anteriormente no están clasificadas en ningún orden particular.
- Obtenga una descripción general de los principales actores clave del mercado de soluciones de disponibilidad en el estante
Noticias del mercado y desarrollos recientes de soluciones de disponibilidad en el mercado
El mercado de soluciones de disponibilidad en el mercado se evalúa mediante la recopilación de datos cualitativos y cuantitativos posteriores a la investigación primaria y secundaria, que incluye publicaciones corporativas importantes, datos de asociaciones y bases de datos. A continuación, se incluye una lista de los avances en el mercado de los trastornos del habla y el lenguaje y las estrategias:
- Retail Velocity, el pionero y líder de la industria en gestión, generación de informes y análisis de datos de oferta y demanda de consumidores, anunció el lanzamiento de la décima generación de su plataforma VELOCITY y la introducción de VELOCITY Essential. Este nuevo VELOCITY Pro 10 ofrece un mayor rendimiento, una gestión de datos más sencilla, generación de informes mejorada y seguridad adicional, lo que permite a los fabricantes de bienes de consumo obtener información más profunda y procesable más rápido que nunca; tomar decisiones colaborativas más informadas internamente y con socios minoristas; y abordar de manera rápida y eficaz la demanda cambiante de los consumidores y las condiciones del mercado. (Fuente: Retail Velocity, comunicado de prensa, 2022)
- Tredence Inc., una empresa líder en ciencia de datos e ingeniería de IA, anunció una asociación con Databricks, el líder en análisis unificado fundado por los creadores originales de Apache Spark. En virtud de esta asociación, las empresas crearon conjuntamente el acelerador On-Shelf Availability Solution (OSA) que ayuda a los minoristas y fabricantes a resolver la falta de existencias mediante la combinación de las capacidades de procesamiento de datos de Databricks y la experiencia de Tredence en IA/ML. (Fuente: Tredence Inc, comunicado de prensa, 2021)
Informe de mercado sobre soluciones de disponibilidad en el mercado: cobertura y resultados
El informe “Tamaño y pronóstico del mercado de soluciones de disponibilidad en el estante (2021-2031)” proporciona un análisis detallado del mercado que cubre las siguientes áreas:
- Tamaño del mercado y pronóstico a nivel global, regional y nacional para todos los segmentos clave del mercado cubiertos bajo el alcance
- Dinámica del mercado, como impulsores, restricciones y oportunidades clave
- Principales tendencias futuras
- Análisis detallado de las cinco fuerzas de Porter y PEST y FODA
- Análisis del mercado global y regional que cubre las tendencias clave del mercado, los principales actores, las regulaciones y los desarrollos recientes del mercado.
- Análisis del panorama de la industria y de la competencia que abarca la concentración del mercado, el análisis de mapas de calor, los actores destacados y los desarrollos recientes
- Perfiles detallados de empresas

Ankita es una profesional dinámica en investigación de mercados y consultoría con más de 8 años de experiencia en los sectores de tecnología, medios de comunicación, TIC, electrónica y semiconductores. Ha liderado y ejecutado con éxito más de 100 proyectos de consultoría e investigación para clientes globales como Microsoft, Oracle, NEC Corporation, SAP, KPMG y Expeditors International. Sus principales competencias incluyen la evaluación de mercado, el análisis de datos, la previsión, la formulación de estrategias, la inteligencia competitiva y la redacción de informes.
Ankita es experta en la gestión de ciclos completos de proyecto, desde el diseño de propuestas de preventa y las conversaciones con los clientes hasta la entrega de información práctica posventa. Es experta en la gestión de equipos multifuncionales, la estructuración de módulos de investigación complejos y la alineación de soluciones con los objetivos de negocio específicos del cliente. Sus excelentes habilidades de comunicación, liderazgo y presentación le han permitido obtener constantemente resultados orientados al valor en entornos de mercado dinámicos y en constante evolución.
- Análisis exhaustivo del tamaño del mercado y previsiones
- Análisis detallado de la segmentación
- Evaluación en profundidad de la dinámica del mercado
- Información a nivel regional y nacional
- Panorama competitivo y análisis comparativo de empresas
- Inteligencia empresarial estratégica
Testimonios
El informe de mercado de sistemas SCADA de Insight Partners es completo y ofrece información valiosa sobre las tendencias actuales y las previsiones futuras. El equipo fue altamente profesional, receptivo y me brindó un gran apoyo en todo momento. Estamos muy satisfechos y recomendamos ampliamente sus servicios.
RAN KEDEM Socio, Reali Technologies LTDsSolicité un informe sobre un mercado de software muy específico y el equipo lo elaboró en pocos días. La información era muy relevante y estaba bien presentada. Posteriormente, solicité algunos cambios y adiciones al informe. El equipo fue muy receptivo y recibí el informe final en menos de una semana.
JEAN-HERVE JENN Presidente, Future AnalyticaTrabajamos con The Insight Partners para un importante estudio y pronóstico de mercado. Nos brindaron una visión clara de las oportunidades y los riesgos, lo que nos ayudó a definir nuestros planes. Su investigación fue fácil de usar y se basó en datos sólidos. Nos ayudó a tomar decisiones inteligentes y seguras. Los recomendamos ampliamente.
PIYUSH NAGPAL Vicepresidente Sénior, , High Beam GlobalThe Insight Partners realizó una investigación de mercado profunda y bien estructurada con una sólida experiencia en el sector. Su equipo fue profesional y receptivo en todo momento. El sitio web, fácil de usar, facilitó el acceso a los informes del sector. Los recomendamos ampliamente por sus servicios de investigación confiables y de alta calidad.
YUKIHIKO ADACHI Director Ejecutivo, , Deep Blue, LLCEsta es la primera vez que compro un informe de mercado de The Insight Partners. Aunque al principio tenía dudas, visité su sitio web y me sentí más cómodo al arriesgarme y comprarlo. Estoy completamente satisfecho con la calidad del informe y el servicio al cliente. Tenía varias preguntas y comentarios sobre el informe inicial, pero después de un par de conversaciones por correo electrónico con su analista, creo que tengo un informe que puedo usar como base para nuestro proceso de planificación estratégica. Muchas gracias por tomarse el tiempo y hacer de esta una experiencia positiva. Sin duda, recomendaré sus servicios y serán mi primera opción cuando necesitemos más datos de mercado.
JOHN SUZUKI Presidente y Director Ejecutivo, Director de la Junta Directiva, BK TechnologiesAgradezco su apoyo y la profesionalidad que demostraron al atender mi solicitud de información sobre el mercado de diagnóstico in vitro (IVD) para enfermedades infecciosas en Nigeria. Agradezco su paciencia, su orientación y su disposición a ofrecerme un descuento, lo que finalmente nos permitió cerrar un trato. Espero poder colaborar con The Insight Partners en el futuro, gracias a la impresión que me causó este primer encuentro.
DRA. CHIJIOKE ONYIA, DIRECTORA GENERAL, PineCrest Healthcare Ltd.Razón para comprar
- Toma de decisiones informada
- Comprensión de la dinámica del mercado
- Análisis competitivo
- Información sobre clientes
- Pronósticos del mercado
- Mitigación de riesgos
- Planificación estratégica
- Justificación de la inversión
- Identificación de mercados emergentes
- Mejora de las estrategias de marketing
- Impulso de la eficiencia operativa
- Alineación con las tendencias regulatorias


