3Dセキュア認証市場レポート2031:セグメント、地域、動向、最近の動向、戦略的洞察
過去データ : 2021-2022 | 基準年 : 2023 | 予測期間 : 2024-20313Dセキュア認証市場の規模と予測(2021年 - 2031年)、世界および地域のシェア、トレンド、成長機会分析レポートの対象範囲:コンポーネント(ソリューションとサービス)、エンドユーザー(銀行、加盟店、決済処理業者)、および地域別
- ステータス : 公開されたデータ
- レポートコード : TIPRE00021739
- カテゴリー : テクノロジー、メディア、通信
- ページ数 : 150
- 利用可能なレポート形式 :


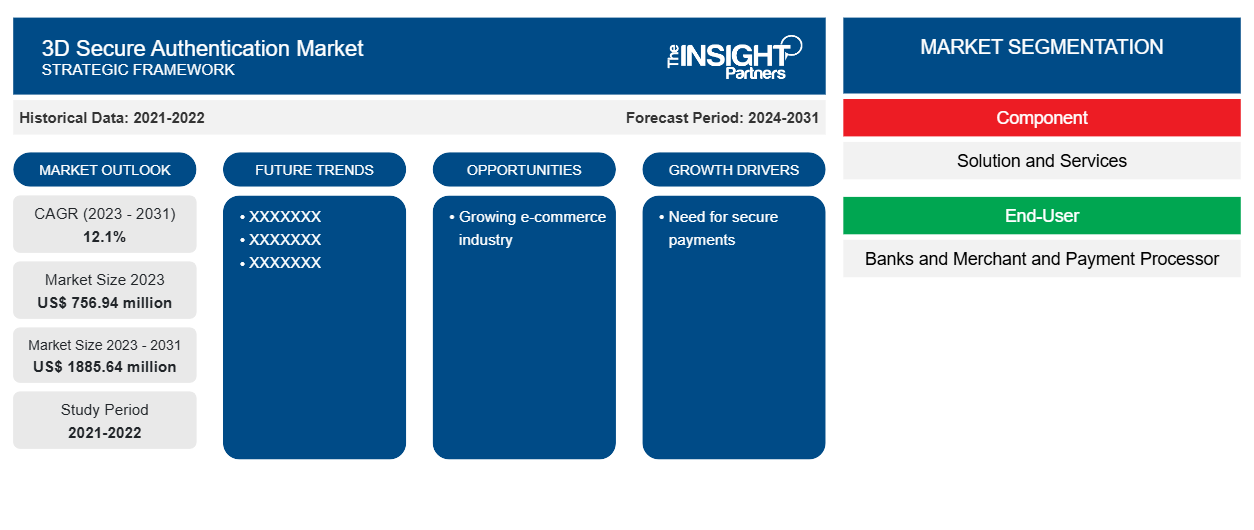
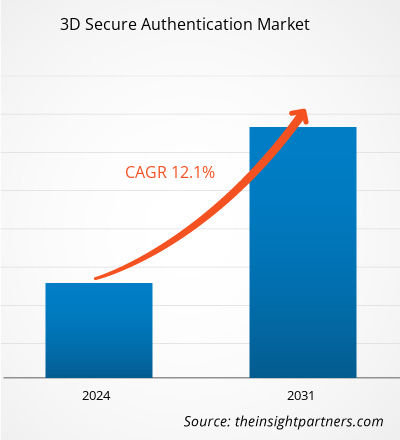
3Dセキュア認証の市場規模は、2023年の7億5,694万米ドルから2031年には1億8,564万米ドルに達すると予測されています。市場は2023年から2031年にかけて12.1%のCAGRを記録すると予想されています。オンライン取引の増加とサイバー攻撃の増加は、今後も市場の主要なトレンドであり続けると思われます。
3Dセキュア認証市場分析
インターネットの普及率の上昇、消費者の可処分所得の増加、デジタル化の採用の増加は、市場の成長を牽引する要因の一部です。電子商取引とモバイルコマース業界の成長により、取引の安全性を確保するソリューションの需要が生まれ、市場の成長につながっています。オンライン取引の増加に伴い、オンライン詐欺に対する懸念が市場を牽引しています。
3Dセキュア認証市場の概要
3D セキュア (3DS) は、企業が決済エコシステムを保護するために採用している認証方法およびセキュリティ プロトコルです。クレジットカード取引のセキュリティをさらに強化します。この認証プロセスでは、決済時に顧客の身元を確認します。ヨーロッパの強力な認証規制 PSD2 や、英国、インド、オーストラリアの同様の規制により、カード決済用の 3D セキュア認証ソリューションの採用が促進されています。
要件に合わせてレポートをカスタマイズする
このレポートの一部、国レベルの分析、Excelデータパックなど、あらゆるレポートを無料でカスタマイズできます。また、スタートアップや大学向けのお得なオファーや割引もご利用いただけます。
3Dセキュア認証市場:戦略的洞察
-
このレポートの主要な市場動向を入手してください。この無料サンプルには、市場動向から見積もりや予測に至るまでのデータ分析が含まれます。
3Dセキュア認証市場の推進要因と機会
安全な支払いの必要性。
デジタル化が進むにつれて、企業は業務を効率的に運営するためにデジタル ソリューションを採用しています。この要因により、企業間で支払いの実行と回収を行うソリューションの採用が進んでいます。顧客の信頼を構築し維持することは重要であるため、支払いエコシステムのセキュリティ保護はあらゆる企業にとって最優先事項です。このため、企業は 3D セキュア認証ソリューションを採用してセキュリティ レイヤーを追加し、不正なオンライン取引を防止しています。
成長する電子商取引業界
インターネットの普及率、スマートフォンの販売、消費者の購買力の高まりにより、電子商取引業界は勢いを増しています。従来のショッピングと比較したオンライン ショッピングの利点としては、実現可能性、手頃な価格、幅広い製品ポートフォリオなどが挙げられます。そのため、顧客は電子商取引プラットフォームを介したショッピングを好む傾向にあります。これにより、顧客による支払いが増加し、3D セキュア認証市場が生まれました。3D セキュア認証は、企業と顧客がより安全なオンライン取引を行うのに役立ちます。このソリューションを採用すると、詐欺のリスクが軽減され、認証の追加レイヤーによってセキュリティが強化されます。
3Dセキュア認証市場レポートのセグメンテーション分析
3D セキュア認証市場分析の導出に貢献した主要なセグメントは、コンポーネントとエンドユーザーです。
- 3Dセキュア認証市場は、コンポーネントに基づいてソリューションとサービスに分かれています。ソリューションセグメントは、2023年に市場で最大のシェアを占めました。
- エンドユーザーに基づいて、3Dセキュア認証市場は銀行と商店および決済プロセッサに分割されています。銀行セグメントは2023年に市場で大きなシェアを占めました。
3Dセキュア認証の地域別市場シェア分析
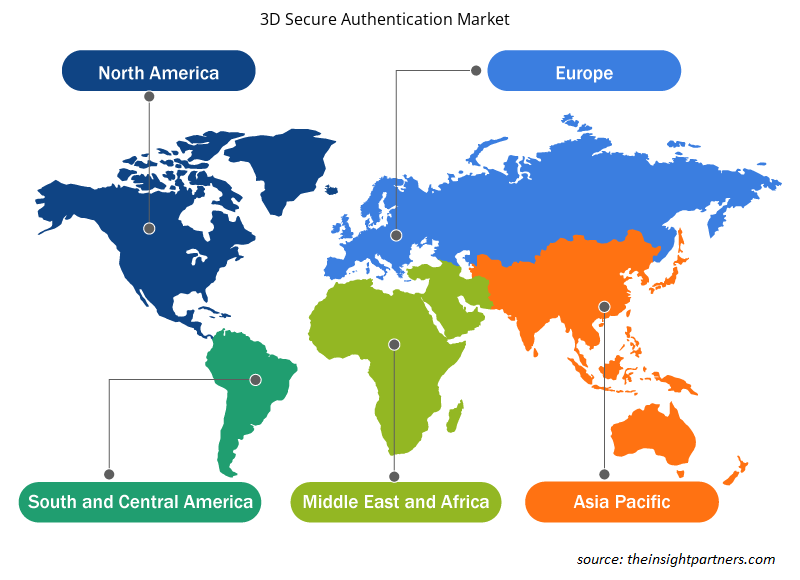
3D セキュア認証市場レポートの地理的範囲は、主に北米、アジア太平洋、ヨーロッパ、中東およびアフリカ、南米および中米の 5 つの地域に分かれています。
アジア太平洋地域は最大の市場シェアを占めており、最高の CAGR で成長すると予想されています。インド、日本、中国などの国々がアジア太平洋地域の市場シェアの大部分を占めています。デジタル技術の採用が、この地域の市場成長を牽引しています。成長する電子商取引業界は、3D セキュア認証市場の成長に貢献しています。
3Dセキュア認証市場の地域別分析
予測期間を通じて 3D セキュア認証市場に影響を与える地域的な傾向と要因は、Insight Partners のアナリストによって徹底的に説明されています。このセクションでは、北米、ヨーロッパ、アジア太平洋、中東およびアフリカ、南米および中米にわたる 3D セキュア認証市場のセグメントと地域についても説明します。
- 3Dセキュア認証市場の地域別データを入手
3Dセキュア認証市場レポートの範囲
| レポート属性 | 詳細 |
|---|---|
| 2023年の市場規模 | 7億5,694万米ドル |
| 2031年までの市場規模 | 1億8,564万米ドル |
| 世界のCAGR(2023年~2031年) | 12.1% |
| 履歴データ | 2021-2022 |
| 予測期間 | 2024-2031 |
| 対象セグメント |
コンポーネント別
|
| 対象地域と国 |
北米
|
| 市場リーダーと主要企業プロフィール |
|
3Dセキュア認証市場のプレーヤー密度:ビジネスダイナミクスへの影響を理解する
3D セキュア認証市場は、消費者の嗜好の変化、技術の進歩、製品の利点に対する認識の高まりなどの要因により、エンドユーザーの需要が高まり、急速に成長しています。需要が高まるにつれて、企業は提供内容を拡大し、消費者のニーズを満たすために革新を起こし、新たなトレンドを活用し、市場の成長をさらに促進しています。
市場プレーヤー密度とは、特定の市場または業界内で活動している企業または会社の分布を指します。これは、特定の市場スペースに、その市場規模または総市場価値に対してどれだけの競合相手 (市場プレーヤー) が存在するかを示します。
3Dセキュア認証市場で事業を展開している主要企業は次のとおりです。
- ネットセテラ
- Gpayment 株式会社
- ASEEグループ
- アジアペイリミテッド
- モディラム
- 株式会社エムシグニア
免責事項:上記の企業は、特定の順序でランク付けされていません。
- 3Dセキュア認証市場のトップキープレーヤーの概要を入手
3Dセキュア認証市場のニュースと最近の動向
3D セキュア認証市場は、主要な企業出版物、協会データ、データベースなどの一次調査と二次調査後の定性的および定量的データを収集することで評価されます。3D セキュア認証市場の動向のいくつかを以下に示します。
- Everlink は、3D セキュア認証の完了と、Visa および Mastercard カード製品の両方を対象に、VISA Consumer Authentication Service (VCAS) を通じて 3D セキュア認証サービスを開始することを発表しました。e コマースが世界中で加速する中、企業は不正行為を防止し、取引がシームレスに承認されるようにする必要があります。現在、不正行為の 79% 以上がカードを提示しない取引で発生しています。3D セキュア認証は、消費者にさらなるセキュリティ レイヤーを提供し、複数のデバイスでのカードを提示しない取引において、カード所有者のエクスペリエンスを向上させ、柔軟性を高めます。(出典: Everlink、プレスリリース、2022 年 1 月)
- インドの大手オンライン決済ソリューションプロバイダーである PayU は、すべてのカード取引で完全なネイティブチェックアウトと優れた顧客体験を提供する 3D Secure 2.0 SDK のリリースを発表しました。PayU 加盟店は、Visa や Mastercard などの主要なカードネットワークのアップグレードに準拠しながら、最適化された顧客体験を提供し、セキュリティと不正防止を強化することができます。PayU の軽量 3DS 2.0 SDK は、レイテンシを低減し、チェックアウト時間を 40% 短縮します。PayU は、PayU が所有するフルスタックのグローバル PayTech 企業である Wibmo と共同で、この EMVCo 認定製品を開発しました。(出典: Procurato、プレスリリース、2023 年 2 月)
3Dセキュア認証市場レポートの対象範囲と成果物
「3Dセキュア認証市場規模と予測(2021〜2031年)」レポートでは、以下の分野をカバーする市場の詳細な分析を提供しています。
- 3Dセキュア認証市場の規模と予測は、対象範囲に含まれるすべての主要市場セグメントについて、世界、地域、国レベルで示されています。
- 3Dセキュア認証市場の動向と、推進要因、制約、主要な機会などの市場動向
- 詳細なPEST/ポーターの5つの力とSWOT分析
- 主要な市場動向、世界および地域の枠組み、主要プレーヤー、規制、最近の市場動向を網羅した3Dセキュア認証市場分析
- 市場集中、ヒートマップ分析、主要プレーヤー、3Dセキュア認証市場の最近の動向を網羅した業界展望と競争分析
- 詳細な企業プロフィール

アンキタは、テクノロジー、メディア、ICT、エレクトロニクス・半導体の各分野で8年以上の経験を持つ、ダイナミックな市場調査およびコンサルティングのプロフェッショナルです。Microsoft、Oracle、NEC、SAP、KPMG、Expeditors Internationalといったグローバルクライアントに対し、100件以上のコンサルティングおよび調査案件を主導・遂行してきました。彼女のコアコンピテンシーは、市場評価、データ分析、予測、戦略策定、競合情報、レポート作成です。
アンキタは、販売前の提案書作成やクライアントとの協議から、販売後の実用的なインサイトの提供まで、プロジェクトサイクル全体を巧みに管理することに長けています。彼女は、部門横断的なチームの管理、複雑な調査モジュールの構築、そしてクライアント固有のビジネス目標に合わせたソリューションの調整に長けています。優れたコミュニケーション能力、リーダーシップ、そしてプレゼンテーション能力により、急速に変化する市場環境において、常に価値主導の成果を生み出しています。
- 過去2年間の分析、基準年、CAGRによる予測(7年間)
- PEST分析とSWOT分析
- 市場規模価値/数量 - 世界、地域、国
- 業界と競争環境
- Excel データセット
お客様の声
Insight PartnersのSCADAシステム市場レポートは包括的で、現在のトレンドと将来の予測に関する貴重な洞察が含まれています。チームは終始、非常にプロフェッショナルで、対応が早く、サポートも充実していました。私たちは彼らのサービスに非常に満足しており、強くお勧めします。
ラン・ケデム パートナー, レアリテクノロジーズ株式会社非常に特殊なソフトウェア市場に関するレポートを依頼したところ、チームは数日でレポートを作成してくれました。情報は非常に関連性が高く、分かりやすくまとめられていました。その後、レポートにいくつか修正と追加を依頼しましたが、チームは非常に迅速に対応し、1週間も経たないうちに最終レポートを受け取ることができました。
ジャン=エルヴェ・ジェン 会長, フューチャー・アナリティカ重要な市場調査と予測のために、The Insight Partnersと協力しました。彼らは機会とリスクに関する明確な洞察を提供し、私たちの計画策定に役立ちました。彼らの調査は使いやすく、確かなデータに基づいており、賢明で自信に満ちた意思決定に役立ちました。彼らを強くお勧めします。
ピユーシュ・ナグパル 上級副社長, ハイビームグローバルInsight Partnersは、深い専門知識に基づき、洞察力に富み、構造化された市場調査を提供しました。チームは終始プロフェッショナルで、対応力も抜群でした。ユーザーフレンドリーなウェブサイトにより、業界レポートへのアクセスもスムーズでした。信頼性の高い高品質な調査サービスをお探しなら、Insight Partnersを強くお勧めします。
安達幸彦 最高経営責任者(CEO), ディープブルーLLC。The Insight Partnersから市場レポートを購入するのは今回が初めてです。最初は不安でしたが、ウェブサイトを見て、リスクを負ってでも購入してみようという気持ちになりました。レポートの品質とカスタマーサービスには大変満足しています。最初のレポートにはいくつか質問やコメントがありましたが、アナリストとメールで何度かやり取りした結果、戦略策定プロセスへのインプットとして活用できるレポートが完成しました。貴重なお時間を割いていただき、貴重な体験をさせていただき、誠にありがとうございました。他の方にもぜひお勧めしたいですし、今後さらに市場データが必要になった際には、まずThe Insight Partnersにご連絡させていただきます。
ジョン・スズキ 社長兼最高経営責任者、取締役, BKテクノロジーズナイジェリアの感染症IVD市場に関する情報提供依頼に対し、ご対応いただいた際、ご尽力とプロフェッショナルな姿勢に深く感謝申し上げます。忍耐強く、的確なアドバイスをいただき、また、最終的に取引成立に至った割引のご提供にも深く感謝申し上げます。今回の最初の出会いで得た強い印象のおかげで、今後もThe Insight Partnersとの連携を心待ちにしております。
チジオケ博士 オニア マネージングディレクター, パインクレストヘルスケア株式会社購入理由
- 情報に基づいた意思決定
- 市場動向の理解
- 競合分析
- 顧客インサイト
- 市場予測
- リスク軽減
- 戦略計画
- 投資の正当性
- 新興市場の特定
- マーケティング戦略の強化
- 業務効率の向上
- 規制動向への対応


 無料サンプルを入手 - 3Dセキュア認証市場