
3D Secure Authentication Market Overview and Growth by 2031
Coverage: By Component (Solution and Services) End-User (Banks and Merchant and Payment Processor), and Geography
- Status : Data Released
- Report Code : TIPRE00021739
- Category : Technology, Media and Telecommunications
- No. of Pages : 150
- Available Report Formats :


- Last update date : July 31, 2024

2023 Market Size
US$ 756.94 Mn
Base year value
2031 Forecast
US$ 1885.64 Mn
Projected by 2031
CAGR 2024-2031
12.1 %
Growth rate
Addressable Market
US$ 10,474.81 Mn
(2024-2031)
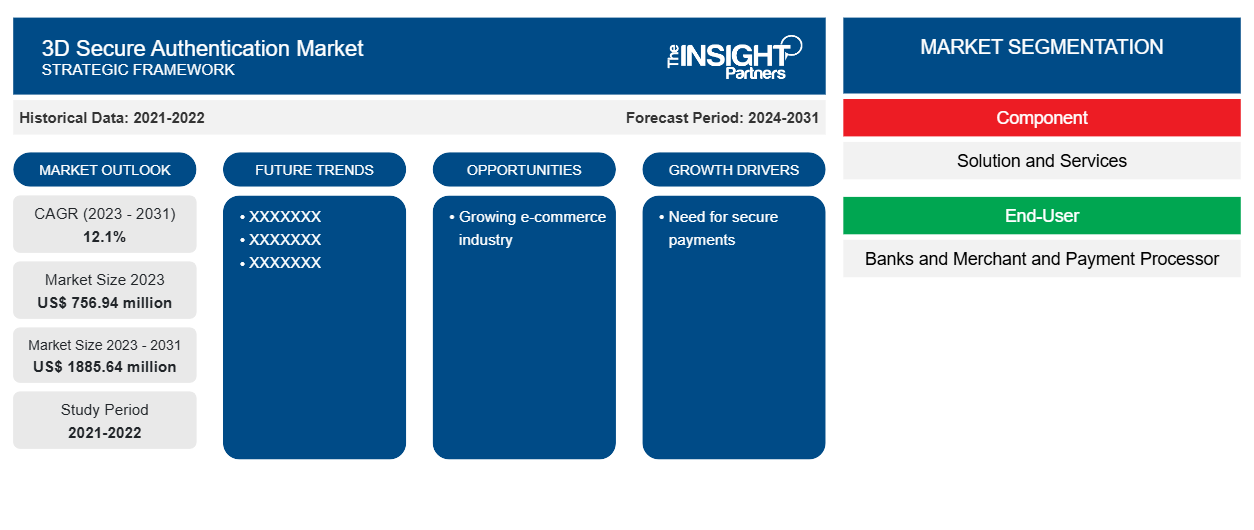
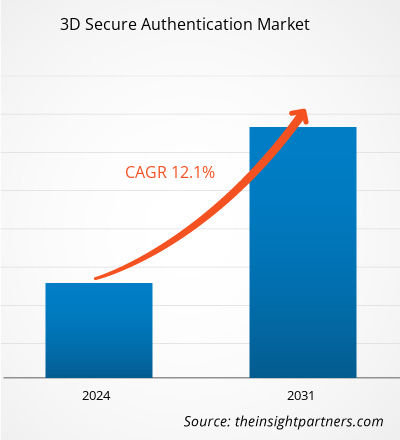
The 3D secure authentication market size is projected to reach US$ 1885.64 million by 2031 from US$ 756.94 million in 2023. The market is expected to register a CAGR of 12.1% during 2023–2031. Rising online transactions and growing cyberattacks are likely to remain key trends in the market.
3D Secure Authentication Market Analysis
The rise in internet penetration, rising consumer disposable income, and the rise in the adoption of digitalization are some of the factors driving the market growth. The rising e-commerce and m-commerce industry generates the demand for solutions to secure transactions, leading to market growth. With the growing number of online transactions, the concerns over online frauds drive the market.
3D Secure Authentication Market Overview
3D Secure (3DS) is an authentication method and a security proto adopted by the business to secure their payment ecosystem. It provides an additional layer of security for credit card transactions. This authentication process verifies the customer's identity during payment. The robust authentication regulation PSD2 in Europe and similar regulations in the UK, India and Australia foster the adoption of 3D secure authentication solutions for card payments.
Market Research Highlights
- Global market for 3D Secure Authentication was valued at US$ 756.94 Million in 2023
- Annual market size is expected to reach US$ 1,885.64 Million by 2031
- Total addressable market (TAM) during 2024-2031 is projected to reach approximately US$ 10,474.81 Million
- Market is anticipated to register a CAGR of 12.1% during the forecast period
- The United States represents a key market, supported by Need for secure payments, as well as evolving industry dynamics
- Market analysis covers North America, Europe, Asia-Pacific, South and Central America, Middle East and Africa, with growth evaluated across the forecast period
- Market opportunities such as Growing e-commerce industry are expected to influence market dynamics and addressable market
- Report profiles industry participants, including Netcetera, Gpayment Pvt Ltd., ASEE GROUP, Asiapay Limited, Modirum, Msignia, Inc., Ravelin Technology Ltd, RS Software, UL LLC, Izealiant Technologies Pvt. Ltd., while analyzing competitive strategies and innovation developments
● REPORT CUSTOMIZATION
Tailor This Report To Align With Your Specific Business Requirements
This report can be customized to align precisely with your business objectives, scope, and target markets. Customization options include tailored segmentation, geography, competitive analysis, and strategic insights to support informed decision-making.
Customize This Report →WHAT YOU CAN ADJUST
- ● Segmentations
- ● Geography
- ● Competitive Analysis
- ● Language Preferences
3D Secure Authentication Market: Strategic Insights
-
Get Top Key Market Trends of this report.This FREE sample will include data analysis, ranging from market trends to estimates and forecasts.
3D Secure Authentication Market Drivers and Opportunities
Need for secure payments.
With the growing digitalization, businesses are adopting digital solutions to efficiently run their business operations. This factor leads to the adoption of solutions, making and collecting payments among the businesses. Securing the payment ecosystem is the utmost priority of any business, as building and maintaining customer trust is important. For this, businesses adopt 3D secure authentication solutions to add an extra security layer to prevent unauthorized online transactions.
Growing e-commerce industry
The e-commerce industry is gaining traction owing to rising internet penetration, sales of smartphones, and rising consumer purchasing power. The feasibility, affordable prices, and wide product portfolio are some of the advantages of online shopping compared to traditional shopping. Therefore, customers are inclined towards shopping via e-commerce platforms. This has led to increased payments by customers, leading to the 3D secure authentication market. 3D secure authentication helps companies and customers make more secure online transactions. Adoption of this solution reduces the risk of fraud and offers more security with an extra layer of authentication.
3D Secure Authentication Market Report Segmentation Analysis
Key segments that contributed to the derivation of the 3D secure authentication market analysis are the component and end-user.
- Based on the component, the 3D secure authentication market is divided into solution and services. The solution segment held the largest share of the market in 2023.
- Based on the end-user, the 3D secure authentication market is segmented into banks and merchant and payment processor. The banks segment held a significant share of the market in 2023.
3D Secure Authentication Market Share Analysis by Geography
The geographic scope of the 3D secure authentication market report is mainly divided into five regions: North America, Asia Pacific, Europe, Middle East & Africa, and South & Central America.
Asia Pacific region held the largest market share and is expected to grow with the highest CAGR. Countries such as India, Japan, and China hold the majority of the Asia Pacific market share. The adoption of digital technologies is fueling the market growth in the region. The growing e-commerce industry is contributing to the growth of the 3D secure authentication market.
3D Secure Authentication Market Report Scope
| Report Attribute | Details |
|---|---|
| Market size in 2023 | US$ 756.94 million |
| Market Size by 2031 | US$ 1885.64 million |
| Global CAGR (2023 - 2031) | 12.1% |
| Historical Data | 2021-2022 |
| Forecast period | 2024-2031 |
| Segments Covered |
By Component
|
| Regions and Countries Covered |
North America
|
| Market leaders and key company profiles |
|
3D Secure Authentication Market Players Density: Understanding Its Impact on Business Dynamics
The 3D Secure Authentication Market is growing rapidly, driven by increasing end-user demand due to factors such as evolving consumer preferences, technological advancements, and greater awareness of the product's benefits. As demand rises, businesses are expanding their offerings, innovating to meet consumer needs, and capitalizing on emerging trends, which further fuels market growth.
3D Secure Authentication Market News and Recent Developments
The 3D secure authentication market is evaluated by gathering qualitative and quantitative data post primary and secondary research, which includes important corporate publications, association data, and databases. A few of the developments in the 3D secure authentication market are listed below:
- Everlink announced the completion of 3D Secure Certification and the launch of its 3D Secure Authentication Service through VISA Consumer Authentication Service (VCAS) for both Visa and Mastercard card products. As eCommerce accelerates worldwide, businesses are required to prevent fraud and ensure transactions are seamlessly approved. Currently, more than 79% of all fraud occurs through card-not-present transactions. 3D Secure Authentication delivers an added layer of security for consumers, providing an improved, more flexible cardholder experience for card-not-present transactions across multiple devices. (Source: Everlink, Press Release, January 2022)
- PayU, India's leading online payments solution provider, announced the launch of 3D Secure 2.0 SDK, offering a full native checkout and superior customer experience for all card transactions. PayU merchants can provide optimized customer experience while complying with major card network upgrades - including Visa and Mastercard while gaining better security and fraud protection. PayU's lightweight 3DS 2.0 SDK provides lowered latency and a 40% reduction in checkout time. PayU had developed this EMVCo certified offering in collaboration with Wibmo, a PayU owned full stack global PayTech company. (Source: Procurato, Press Release, February 2023)
3D Secure Authentication Market Report Coverage and Deliverables
The “3D Secure Authentication Market Size and Forecast (2021–2031)” report provides a detailed analysis of the market covering below areas:
- 3D secure authentication market size and forecast at global, regional, and country levels for all the key market segments covered under the scope
- 3D secure authentication market trends as well as market dynamics such as drivers, restraints, and key opportunities
- Detailed PEST/Porter’s Five Forces and SWOT analysis
- 3D secure authentication market analysis covering key market trends, global and regional framework, major players, regulations, and recent market developments
- Industry landscape and competition analysis covering market concentration, heat map analysis, prominent players, and recent developments for the 3D secure authentication market
- Detailed company profiles
Frequently Asked Questions

- Comprehensive Market Sizing and Forecast Analysis
- Detailed Segmentation Analysis
- In-Depth Market Dynamics Assessment
- Regional and Country-Level Insights
- Competitive Landscape and Company Benchmarking
- Strategic Business Intelligence
Recent Reports
Testimonials
The Insight Partners' SCADA System Market report is comprehensive, with valuable insights on current trends and future forecasts. The team was highly professional, responsive, and supportive throughout. We are very satisfied and highly recommend their services.
RAN KEDEM Partner, Reali Technologies LTDsI requested a report on a very specific software market and the team produced the report in a few days. The information was very relevant and well presented. I then requested some changes and additions to the report. The team was again very responsive and I got the final report in less than a week.
JEAN-HERVE JENN Chairman, Future AnalyticaWe worked with The Insight Partners for an important market study and forecast. They gave us clear insights into opportunities and risks, which helped shape our plans. Their research was easy to use and based on solid data. It helped us make smart, confident decisions. We highly recommend them.
PIYUSH NAGPAL Sr. Vice President, High Beam GlobalThe Insight Partners delivered insightful, well-structured market research with strong domain expertise. Their team was professional and responsive throughout. The user-friendly website made accessing industry reports seamless. We highly recommend them for reliable, high-quality research services
YUKIHIKO ADACHI CEO, Deep Blue, LLC.This is the first time I have purchased a market report from The Insight Partners.While I was unsure at first, I visited their web site and felt more comfortable to take the risk and purchase a market report.I am completely satisfied with the quality of the report and customer service. I had several questions and comments with the initial report, but after a couple of dialogs over email with their analyst I believe I have a report that I can use as input to our strategic planning process.Thank you so much for taking the extra time and making this a positive experience.I will definitely recommend your service to others and you will be my first call when we need further market data.
JOHN SUZUKI President and Chief Executive Officer, Board Director, BK TechnologiesI wish to appreciate your support and the professionalism you displayed in the course of attending to my request for information regarding to infectious disease IVD market in Nigeria. I appreciate your patience, your guidance, and the fact that you were willing to offer a discount, which eventually made it possible for us to close a deal. I look forward to engaging The Insight Partners in the future, all thanks to the impression you have created in me as a result of this first encounter.
DR CHIJIOKE ONYIA MANAGING DIRECTOR, PineCrest Healthcare Ltd.Reason to Buy
- Informed Decision-Making
- Understanding Market Dynamics
- Competitive Analysis
- Identifying Emerging Markets
- Customer Insights
- Market Forecasts
- Risk Mitigation
- Boosting Operational Efficiency
- Strategic Planning
- Investment Justification
- Tracking Industry Innovations
- Aligning with Regulatory Trends


