نظرة عامة على سوق تحليلات البيانات الضخمة، النمو، الاتجاهات، التحليل، تقرير البحث (2024-2031)
البيانات التاريخية : 2021-2023 | سنة الأساس : 2024 | فترة التنبؤ : 2024-2031حجم سوق تحليلات البيانات الضخمة وتوقعاته (2021-2031)، والحصة العالمية والإقليمية، والاتجاهات، وفرص النمو. يغطي التقرير: حسب المكون (البرمجيات والخدمات)، والنشر (السحابة والمحلية)، والتطبيق (تحليلات العملاء، وتحليلات سلسلة التوريد، وتحليلات التسويق، وتحليلات التسعير، وتحليلات القوى العاملة، وغيرها)، وقطاع المستخدم النهائي (تكنولوجيا المعلومات والاتصالات، والخدمات المصرفية والمالية والتأمين، والرعاية الصحية، وتجارة التجزئة، وغيرها)، والجغرافيا.
- تاريخ التقرير : Mar 2025
- رمز التقرير : TIPRE00029289
- الفئة : التكنولوجيا والإعلام والاتصالات
- الحالة : نُشرت
- تنسيقات التقارير المتاحة :


- عدد الصفحات : 305
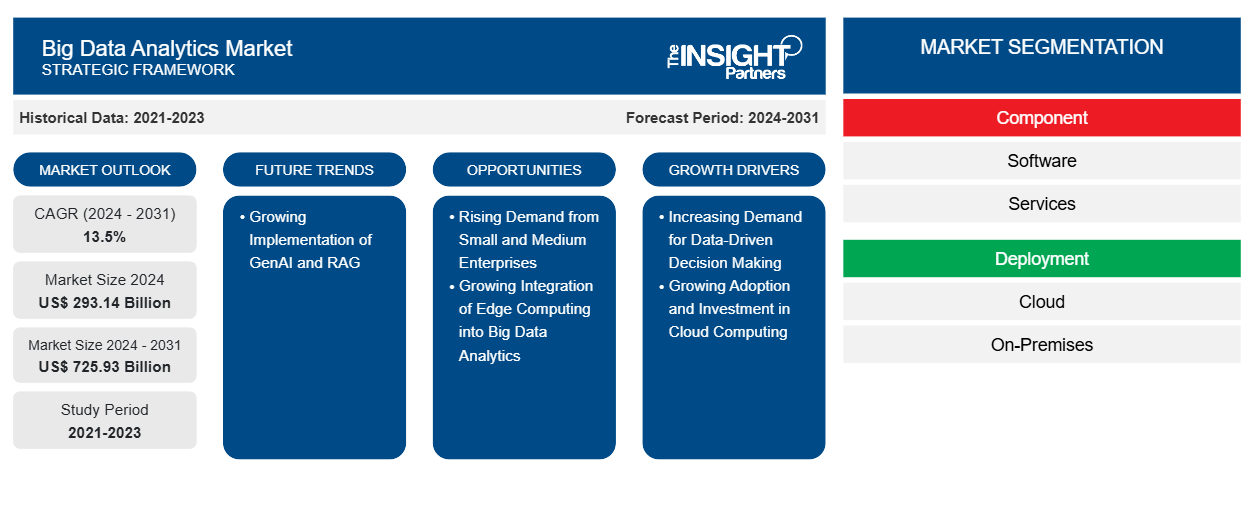
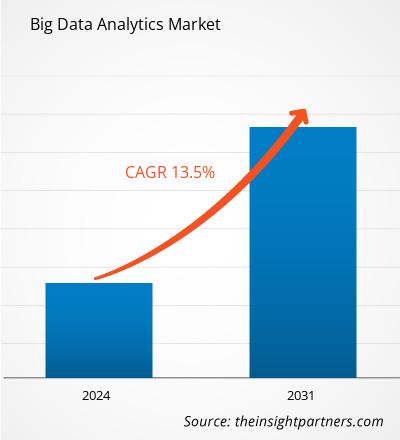
من المتوقع أن يصل حجم سوق تحليلات البيانات الضخمة إلى 725.93 مليار دولار أمريكي بحلول عام 2031، مقارنةً بـ 293.14 مليار دولار أمريكي في عام 2024. ومن المتوقع أن يسجل السوق معدل نمو سنوي مركب قدره 13.5% خلال الفترة 2024-2031. ومن المرجح أن يُسهم التطبيق المتزايد لتقنيات GenAI وRAG في ظهور اتجاهات جديدة في السوق خلال السنوات القادمة.
تحليل سوق تحليلات البيانات الضخمة
عوامل مثل الطلب المتزايد على اتخاذ القرارات القائمة على البيانات وتزايد التبني والاستثمار في الحوسبة السحابية تدفع سوق تحليلات البيانات الضخمة . ومن المتوقع أن ينمو السوق خلال فترة التنبؤ بسبب الطلب المتزايد من الشركات الصغيرة والمتوسطة (SMEs) والتطبيق المتزايد للحوسبة الحافة في تحليلات البيانات الضخمة. ومن المرجح أن يؤدي تطبيق GenAI وRAG إلى جلب اتجاهات جديدة إلى السوق في السنوات القادمة. علاوة على ذلك، يشهد السوق نموًا كبيرًا، مدفوعًا بالحجم المتزايد للبيانات المنتجة عبر الصناعات والحاجة المتزايدة للمؤسسات لاستخلاص رؤى قابلة للتنفيذ من هذه البيانات. وتشمل المحركات الأخرى التبني الواسع النطاق لأجهزة إنترنت الأشياء (IoT) ومنصات التواصل الاجتماعي والأجهزة الذكية، والتي تولد كميات هائلة من البيانات التي تتطلب تحليلات متقدمة لاستخراج معلومات ذات مغزى.
نظرة عامة على سوق تحليلات البيانات الضخمة
يُشجع التركيز المتزايد على خفض التكاليف والكفاءة التشغيلية الشركات على الاستثمار في حلول تحليلات البيانات الضخمة. وتبرز فرصٌ واعدة في قطاعاتٍ مثل الرعاية الصحية، وتجارة التجزئة، والتمويل، والتصنيع، حيث يُمكن لتحليلات البيانات أن تُحسّن تجارب العملاء، وتُحسّن سلاسل التوريد، وتُحسّن عملية اتخاذ القرارات المالية، وتُمكّن الصيانة التنبؤية. علاوةً على ذلك، يُتيح دمج الذكاء الاصطناعي والتعلم الآلي مع تحليلات البيانات الضخمة إمكانياتٍ جديدةً للنمذجة التنبؤية، والتوصيات المُخصصة، والأتمتة. وفيما يتعلق بالاتجاهات المستقبلية، من المتوقع أن يشهد السوق اعتماداً متزايداً على حلول البيانات الضخمة القائمة على السحابة، حيث تسعى الشركات إلى تحقيق قابلية التوسع، وفعالية التكلفة، والوصول عن بُعد إلى منصات التحليلات.
قم بتخصيص هذا التقرير ليناسب متطلباتك
ستحصل على تخصيص لأي تقرير - مجانًا - بما في ذلك أجزاء من هذا التقرير، أو تحليل على مستوى الدولة، وحزمة بيانات Excel، بالإضافة إلى الاستفادة من العروض والخصومات الرائعة للشركات الناشئة والجامعات
سوق تحليلات البيانات الضخمة: رؤى استراتيجية
-
احصل على أهم اتجاهات السوق الرئيسية لهذا التقرير.ستتضمن هذه العينة المجانية تحليل البيانات، بدءًا من اتجاهات السوق وحتى التقديرات والتوقعات.
محركات وفرص سوق تحليلات البيانات الضخمة
تزايد التبني والاستثمار في الحوسبة السحابية
يُغذّي تزايد اعتماد الحوسبة السحابية والاستثمار فيها نموّ سوق تحليلات البيانات الضخمة. وتستفيد المؤسسات بشكل متزايد من تقنيات الحوسبة السحابية لمعالجة وتحليل كميات هائلة من البيانات. يُحدث هذا التحوّل تحوّلاً في طريقة تعامل الشركات مع إدارة البيانات وقابلية التوسع والقدرات التحليلية. تُوفّر الحوسبة السحابية بنية تحتية أفضل، وكفاءة في التكلفة، وقابلية للتوسع، وميزات متقدمة ضرورية لتسخير كامل إمكانات تحليلات البيانات الضخمة، مما يُمكّن الشركات من اتخاذ قرارات قائمة على البيانات بفعالية وكفاءة أكبر. تستثمر الشركات الكبرى في البنية التحتية للذكاء الاصطناعي والحوسبة السحابية، مما يُعزّز اعتماد تحليلات البيانات الضخمة عالميًا. فيما يلي بعض الأمثلة:
- في أكتوبر 2024، أعلنت مايكروسوفت التزامها باستثمار 4.3 مليار يورو (4.75 مليار دولار أمريكي) في توسيع بنيتها التحتية لمراكز بيانات السحابة والذكاء الاصطناعي في إيطاليا، مما يُبرز تركيز الشركة الاستراتيجي على تعزيز مكانتها في سوق تحليلات البيانات سريع النمو في أوروبا. يدعم هذا الاستثمار الحوسبة السحابية في المنطقة، التي تشهد نموًا قويًا بالفعل، مدفوعًا بالطلب المتزايد على حلول الذكاء الاصطناعي المتقدمة، وتحليلات البيانات الضخمة، وخدمات التحول الرقمي. سيعزز هذا التوسع قدرات مايكروسوفت في توفير خدمات سحابية قابلة للتطوير وآمنة وعالية الأداء، بالإضافة إلى مواكبة نمو تحليلات البيانات الضخمة في أوروبا.
- في يونيو 2024، واستجابةً للطلب المتزايد على الذكاء الاصطناعي وخدمات الحوسبة السحابية في إسبانيا، كشفت أوراكل عن خطط لاستثمار أكثر من مليار دولار أمريكي في إنشاء منطقة سحابية ثالثة في مدريد. تهدف هذه المبادرة إلى تسريع تطوير خبرات الذكاء الاصطناعي على الصعيد الوطني، مع تعزيز قدرات الحوسبة السحابية لعملاء أوراكل وشركائها، لا سيما في قطاعات مثل الخدمات المالية. يعكس هذا التوسع التوجه الأوسع نحو تنامي اعتماد تحليلات البيانات الضخمة في جميع أنحاء أوروبا، حيث تسعى الشركات بشكل متزايد إلى حلول سحابية متقدمة للاستفادة من الرؤى المستندة إلى البيانات ودفع عجلة الابتكار في قطاعات مثل التمويل والرعاية الصحية.
التكامل المتزايد للحوسبة الحافة في تحليلات البيانات الضخمة
تُمكّن معالجة البيانات الموزعة من تحليل البيانات ومعالجتها في مكان أقرب إلى مصدرها، مما يُقلل الاعتماد على البنية التحتية السحابية المركزية ويُسهّل الحصول على رؤى آنية. تستطيع أجهزة الحافة التعامل مع مهام المعالجة المسبقة والتصفية المعقدة، مما يُساعد على تحسين موارد السحابة لإجراء تحليلات متقدمة. تُتيح هذه المعالجة الأسرع للبيانات تحديد الاتجاهات والاختلالات بسرعة، مما يُعزز عملية اتخاذ القرار على المستوى التشغيلي.
تُمهّد الحوسبة الطرفية الطريق لتطبيقات ناشئة، مثل الصيانة التنبؤية للمعدات الصناعية، وإدارة حركة المرور في الوقت الفعلي، والتوصيات المُخصّصة في قطاع التجزئة، مما يُعزّز الابتكار في مختلف القطاعات. يُحدث نموّ الحوسبة الطرفية ثورةً في تحليلات البيانات الضخمة، إذ يُتيح معالجة البيانات أقرب إلى مصدرها، مما يُزوّد الشركات برؤى آنية، ويُحسّن الكفاءة التشغيلية، ويُتيح فرصًا تطبيقية جديدة. ورغم التحديات القائمة، فإنّ التطورات التكنولوجية المُستمرة والتركيز القوي على الأمن يُمهّدان الطريق لتكامل الحوسبة الطرفية بسلاسة مع تحليلات البيانات الضخمة، مما يُحفّز المزيد من الابتكار والتحسينات في العمليات التجارية.
من المتوقع أن تُسهم التطورات في تكنولوجيا الرقائق، وتحسين البرمجيات، وبروتوكولات الأمان في معالجة التحديات القائمة. وسيُسهّل ظهور منصات الحوسبة الطرفية الموحدة الوصول إلى هذه التكنولوجيا، مما يُبسّط النشر والإدارة. إضافةً إلى ذلك، سيُمكّن الذكاء الاصطناعي والتعلم الآلي المُدمجان في الجهاز من تحليل البيانات بشكل أسرع وأكثر تطورًا وأقرب إلى المصدر. كما ستُكمّل الحوسبة الطرفية التحليلات السحابية، مُعززةً بذلك بنيةً هجينةً تُحسّن معالجة البيانات وتخزينها. ومع تطور التكنولوجيا، سيكون التركيز القوي على الأمن والخصوصية ضروريًا لضمان ممارسات حوسبة طرفية مسؤولة.
ومن ثم، فمن المتوقع أن يؤدي التكامل المتزايد للحوسبة الحافة في تحليلات البيانات الضخمة إلى خلق فرص لنمو السوق خلال فترة التنبؤ.
تقرير تحليلات البيانات الضخمة وتحليل التجزئة في سوق تحليلات البيانات الضخمة
القطاعات الرئيسية التي ساهمت في اشتقاق تحليل سوق تحليلات البيانات الضخمة هي صناعة المكونات والنشر والتطبيق والمستخدم النهائي.
- يُقسّم سوق تحليلات البيانات الضخمة، حسب مكوناته، إلى برمجيات وخدمات. وقد استحوذ قطاع البرمجيات على حصة أكبر من السوق في عام ٢٠٢٤.
- من حيث النشر، ينقسم سوق تحليلات البيانات الضخمة إلى سحابية ومحلية. وسيستحوذ قطاع السحابة على حصة أكبر من السوق بحلول عام ٢٠٢٤.
- بناءً على التطبيق، يُقسّم سوق تحليلات البيانات الضخمة إلى تحليلات العملاء، وتحليلات التسويق، وتحليلات التسعير، وتحليلات القوى العاملة، وغيرها. وسيُهيمن قطاع التحليلات الأخرى على السوق بحلول عام 2024.
- من حيث قطاع المستخدم النهائي، يُقسّم سوق تحليلات البيانات الضخمة إلى قطاعات تكنولوجيا المعلومات والاتصالات، والخدمات المصرفية والمالية والتأمين، والرعاية الصحية، وتجارة التجزئة، وغيرها. وقد استحوذت القطاعات الأخرى على الحصة الأكبر من السوق في عام 2024.
تحليل حصة سوق تحليلات البيانات الضخمة حسب البلد
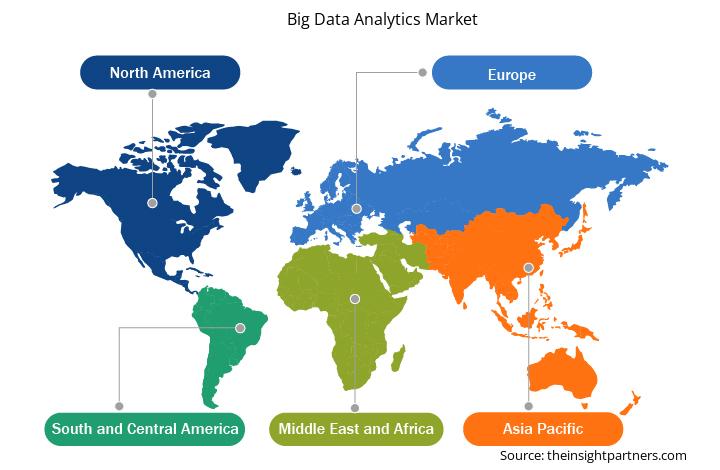
ينقسم النطاق الجغرافي لتقرير سوق تحليلات البيانات الضخمة بشكل أساسي إلى أمريكا الشمالية وأوروبا ومنطقة آسيا والمحيط الهادئ (APAC) والشرق الأوسط وأفريقيا (MEA) وأمريكا الجنوبية والوسطى.
استحوذت المملكة المتحدة على حصة كبيرة من السوق في عام 2024. في أكتوبر 2024، كشفت أربع شركات أمريكية كبرى عن خطط لاستثمار 6.3 مليار جنيه إسترليني (78.3 مليار دولار أمريكي) في البنية التحتية للبيانات في المملكة المتحدة. وقد أشاد وزير التكنولوجيا بهذا الإعلان، الذي صدر في قمة الاستثمار الدولية، ووصفه بأنه "تصويت بالثقة" في استراتيجية المملكة المتحدة للتعاون مع الشركات لتعزيز النمو الاقتصادي. تعد CyrusOne وServiceNow وCloudHQ وCoreWeave من بين الشركات القليلة التي التزمت باستثمارات كبيرة، مما ساهم في استثمار إجمالي يزيد عن 25 مليار جنيه إسترليني (31.1 مليار دولار أمريكي) في مراكز البيانات في المملكة المتحدة. ستعمل هذه المرافق الجديدة على تعزيز قوة الحوسبة وقدرات تخزين البيانات في البلاد بشكل كبير، وهي ضرورية لتطوير ونشر تقنيات الجيل التالي القائمة على الذكاء الاصطناعي. علاوة على ذلك، يسلط هذا الاستثمار الكبير الضوء على النمو السريع لسوق تحليلات البيانات الضخمة في المملكة المتحدة، والذي يستمر في التوسع حيث تدرك الشركات بشكل متزايد الحاجة إلى بنية تحتية قوية للبيانات. بفضل مراكز البيانات الجديدة هذه، تُرسّخ المملكة المتحدة مكانتها كلاعب رئيسي في اقتصاد البيانات العالمي، مُقدّمةً الموارد اللازمة لتلبية الطلب المتزايد على الحلول القائمة على البيانات، والذكاء الاصطناعي، والتعلم الآلي. ومع تزايد الحاجة إلى تحليلات بيانات متقدمة في قطاعات مثل الرعاية الصحية، والمالية، والتصنيع، يُعدّ توسيع البنية التحتية للبيانات في المملكة المتحدة أمرًا بالغ الأهمية لتعزيز الابتكار والحفاظ على ميزة تنافسية في العصر الرقمي. يُعزز هذا التدفق الاستثماري مكانة المملكة المتحدة كمركز للبيانات، كما يُغذّي مبادرات التحول الرقمي الأوسع نطاقًا في البلاد.
رؤى إقليمية حول سوق تحليلات البيانات الضخمة
قام محللو إنسايت بارتنرز بشرح شامل للاتجاهات والعوامل الإقليمية المؤثرة في سوق تحليلات البيانات الضخمة خلال فترة التوقعات. ويناقش هذا القسم أيضًا قطاعات سوق تحليلات البيانات الضخمة ونطاقها الجغرافي في أمريكا الشمالية، وأوروبا، وآسيا والمحيط الهادئ، والشرق الأوسط وأفريقيا، وأمريكا الجنوبية والوسطى.
- احصل على بيانات إقليمية محددة لسوق تحليلات البيانات الضخمة
نطاق تقرير سوق تحليلات البيانات الضخمة
| سمة التقرير | تفاصيل |
|---|---|
| حجم السوق في عام 2024 | 293.14 مليار دولار أمريكي |
| حجم السوق بحلول عام 2031 | 725.93 مليار دولار أمريكي |
| معدل النمو السنوي المركب العالمي (2024 - 2031) | 13.5% |
| البيانات التاريخية | 2021-2023 |
| فترة التنبؤ | 2024-2031 |
| القطاعات المغطاة |
حسب المكون
|
| المناطق والدول المغطاة |
أمريكا الشمالية
|
| قادة السوق وملفات تعريف الشركات الرئيسية |
|
كثافة اللاعبين في سوق تحليلات البيانات الضخمة: فهم تأثيرها على ديناميكيات الأعمال
يشهد سوق تحليلات البيانات الضخمة نموًا سريعًا، مدفوعًا بتزايد طلب المستخدمين النهائيين نتيجةً لعوامل مثل تطور تفضيلات المستهلكين، والتقدم التكنولوجي، وزيادة الوعي بمزايا المنتج. ومع تزايد الطلب، تعمل الشركات على توسيع عروضها، والابتكار لتلبية احتياجات المستهلكين، والاستفادة من الاتجاهات الناشئة، مما يُعزز نمو السوق.
تشير كثافة اللاعبين في السوق إلى توزيع الشركات العاملة في سوق أو قطاع معين. وتشير إلى عدد المنافسين (اللاعبين في السوق) الموجودين في سوق معين نسبةً إلى حجمه أو قيمته السوقية الإجمالية.
الشركات الرئيسية العاملة في سوق تحليلات البيانات الضخمة هي:
- شركة أمازون لخدمات الويب
- فيكو
- شركة هيوليت باكارد إنتربرايز
- شركة آلات الأعمال الدولية
- شركة مايكروسوفت
- شركة أوراكل
إخلاء المسؤولية : الشركات المذكورة أعلاه ليست مرتبة بأي ترتيب معين.
- احصل على نظرة عامة على أهم اللاعبين الرئيسيين في سوق تحليلات البيانات الضخمة
أخبار سوق تحليلات البيانات الضخمة والتطورات الأخيرة
يُقيّم سوق تحليلات البيانات الضخمة بجمع البيانات النوعية والكمية بعد إجراء البحوث الأولية والثانوية، والتي تشمل منشورات الشركات المهمة، وبيانات الجمعيات، وقواعد البيانات. فيما يلي بعض التطورات في سوق تحليلات البيانات الضخمة:
- أعلنت شركة ساس (SAS) عن اتفاقية توزيع جديدة مع شركة كاراهسوفت تكنولوجي، المزود الموثوق لحلول تكنولوجيا المعلومات الحكومية. وبموجب هذه الاتفاقية، ستكون كاراهسوفت موزعًا معتمدًا لحلول ساس في القطاع العام، مما يتيح حلول التحليلات والذكاء الاصطناعي وإدارة البيانات التي تقدمها الشركة للوكالات الحكومية الأمريكية من خلال شركاء كاراهسوفت الموزعين، بالإضافة إلى مختلف آليات التعاقد والجداول الزمنية الحكومية. (المصدر: معهد ساس، بيان صحفي، فبراير 2024)
- كشفت Teradata، منصة البيانات السحابية المتعددة المتصلة، عن مُكوّن تكامل تحليلي جديد لـ Dataiku، منصة "الذكاء الاصطناعي اليومي". تهدف إضافات Teradata الجديدة لـ Dataiku إلى تمكين فرق التحليلات وعلوم البيانات التي تستخدم Dataiku من تنفيذ عمليات تحليلية مُتنوعة ضمن منصة Teradata Vantage. (المصدر: شركة Teradata، بيان صحفي، ديسمبر 2021)
تغطية تقرير سوق تحليلات البيانات الضخمة والمنتجات النهائية
يقدم تقرير "حجم سوق تحليلات البيانات الضخمة والتوقعات (2021-2031)" تحليلاً مفصلاً للسوق يغطي المجالات التالية:
- حجم سوق تحليلات البيانات الضخمة وتوقعاتها على المستويين العالمي والوطني لجميع قطاعات السوق الرئيسية التي يغطيها النطاق
- اتجاهات سوق تحليلات البيانات الضخمة، بالإضافة إلى ديناميكيات السوق مثل المحركات والقيود والفرص الرئيسية
- تحليل مفصل لـ PEST و SWOT
- تحليل سوق تحليلات البيانات الضخمة الذي يغطي اتجاهات السوق الرئيسية والإطار العالمي والجهات الفاعلة الرئيسية واللوائح والتطورات الأخيرة في السوق
- تحليل المشهد الصناعي والمنافسة الذي يغطي تركيز السوق، وتحليل خريطة الحرارة، واللاعبين البارزين، والتطورات الأخيرة لسوق تحليلات البيانات الضخمة
- ملفات تعريف الشركة التفصيلية

أنكيتا خبيرة ديناميكية في أبحاث السوق والاستشارات، تتمتع بخبرة تزيد عن 8 سنوات في قطاعات التكنولوجيا والإعلام وتكنولوجيا المعلومات والاتصالات والإلكترونيات وأشباه الموصلات. وقد قادت ونفذت بنجاح أكثر من 100 مهمة استشارية وبحثية لعملاء عالميين مثل مايكروسوفت وأوراكل وشركة NEC وSAP وKPMG وExpeditors International. تشمل كفاءاتها الأساسية تقييم السوق، وتحليل البيانات، والتنبؤ، وصياغة الاستراتيجيات، والاستخبارات التنافسية، وكتابة التقارير.
أنكيتا بارعة في إدارة دورات المشاريع الكاملة، بدءًا من تصميم عروض ما قبل البيع ومناقشات العملاء، وصولًا إلى تقديم رؤى عملية بعد البيع. كما أنها ماهرة في إدارة فرق متعددة الوظائف، وهيكلة وحدات بحثية معقدة، ومواءمة الحلول مع أهداف العمل الخاصة بالعملاء. وقد مكنتها مهاراتها الممتازة في التواصل والقيادة والعرض التقديمي من تحقيق نتائج قيّمة باستمرار في بيئات سوقية سريعة التطور.
- التحليل التاريخي (سنتان)، سنة الأساس، التوقعات (7 سنوات) مع معدل النمو السنوي المركب
- تحليل PEST و SWOT
- حجم السوق والقيمة / الحجم - عالمي، إقليمي، بلد
- الصناعة والمنافسة
- مجموعة بيانات إكسل
التقارير الحديثة
تقارير ذات صلة
شهادات العملاء
تقرير سوق أنظمة SCADA من Insight Partners شامل، ويقدم رؤى قيّمة حول الاتجاهات الحالية والتوقعات المستقبلية. تميّز الفريق باحترافية عالية وسرعة في الاستجابة ودعم مستمر طوال الوقت. نحن راضون جدًا ونوصي بشدة بخدماتهم.
ران كيديم شريك, شركة ريالي تكنولوجيز المحدودةطلبتُ تقريرًا عن سوق برمجيات محدد، وأعدّه الفريق في غضون أيام قليلة. كانت المعلومات ذات صلة وثيقة وعرضها جيد. ثم طلبتُ بعض التعديلات والإضافات على التقرير. وكان الفريق متجاوبًا للغاية، وحصلتُ على التقرير النهائي في أقل من أسبوع.
جان هيرفيه جين رئيس مجلس الإدارة, فيوتشر أناليتيكاعملنا مع شركة "إنسايت بارتنرز" لإجراء دراسة سوقية وتوقعات مهمة. زودونا برؤى واضحة حول الفرص والمخاطر، مما ساعدنا في صياغة خططنا. كانت أبحاثهم سهلة الاستخدام ومبنية على بيانات دقيقة، مما ساعدنا على اتخاذ قرارات ذكية وواثقة. نوصي بهم بشدة.
بيوش ناجبال نائب الرئيس الأول, شعاع عالي عالميقدّمت شركة Insight Partners أبحاثًا سوقية ثاقبة ومنظمة جيدًا بخبرة واسعة في هذا المجال. تميّز فريقهم بالاحترافية وسرعة الاستجابة طوال الوقت. وسهّل موقعهم الإلكتروني سهل الاستخدام الوصول إلى تقارير القطاع. نوصي بهم بشدة لخدمات بحثية موثوقة وعالية الجودة.
يوكيهيكو أداتشي المدير التنفيذي, ديب بلو، ذ.م.م.هذه أول مرة أشتري فيها تقرير سوق من The Insight Partners. رغم أنني كنت مترددًا في البداية، إلا أنني زرت موقعهم الإلكتروني وشعرت براحة أكبر للمخاطرة وشراء تقرير السوق. أنا راضٍ تمامًا عن جودة التقرير وخدمة العملاء. كانت لديّ عدة أسئلة وتعليقات حول التقرير الأولي، ولكن بعد بضع محادثات عبر البريد الإلكتروني مع محللهم، أعتقد أن لديّ تقريرًا يمكنني استخدامه كمدخل لعملية التخطيط الاستراتيجي لدينا. شكرًا جزيلاً لكم على تخصيص وقتكم الإضافي وجعل هذه التجربة إيجابية. سأوصي بخدماتكم للآخرين بالتأكيد، وستكونون أول من ألجأ إليه عندما نحتاج إلى المزيد من بيانات السوق.
جون سوزوكي الرئيس والرئيس التنفيذي وعضو مجلس الإدارة, بي كيه تكنولوجيزأود أن أقدّر دعمكم واحترافيتكم في الاستجابة لطلبي للحصول على معلومات بشأن سوق التشخيص المخبري للأمراض المعدية في نيجيريا. كما أُقدّر صبركم وتوجيهكم، واستعدادكم لتقديم خصم، مما مكّننا في النهاية من إتمام الصفقة. أتطلع إلى التعامل مع "ذا إنسايت بارتنرز" مستقبلًا، كل ذلك بفضل الانطباع الذي تركتموه لديّ نتيجةً لهذا اللقاء الأول.
الدكتور تشيجيوك أونيا المدير الإداري, شركة باينكريست للرعاية الصحية المحدودةسبب الشراء
- اتخاذ قرارات مدروسة
- فهم ديناميكيات السوق
- تحليل المنافسة
- رؤى العملاء
- توقعات السوق
- تخفيف المخاطر
- التخطيط الاستراتيجي
- مبررات الاستثمار
- تحديد الأسواق الناشئة
- تحسين استراتيجيات التسويق
- تعزيز الكفاءة التشغيلية
- مواكبة التوجهات التنظيمية


 احصل على عينة مجانية ل - سوق تحليلات البيانات الضخمة