Analyse et prévisions du marché des logiciels de création de diagrammes par taille, part, croissance et tendances 2031
Données historiques : 2021-2022 | Année de référence : 2023 | Période de prévision : 2024-2031Analyse de la taille et des prévisions du marché des logiciels de création de diagrammes (2021-2031), des parts mondiales et régionales, des tendances et des opportunités de croissance. Couverture du rapport : par type de déploiement (cloud et sur site), taille de l'entreprise (petites et moyennes entreprises et grandes entreprises), application (établissements d'enseignement, grandes entreprises et particuliers) et géographie.
- Statut : Données publiées
- Code du rapport : TIPRE00011177
- Catégorie : Technologie, médias et télécommunications
- Nombre de pages : 150
- Formats de rapport disponibles :


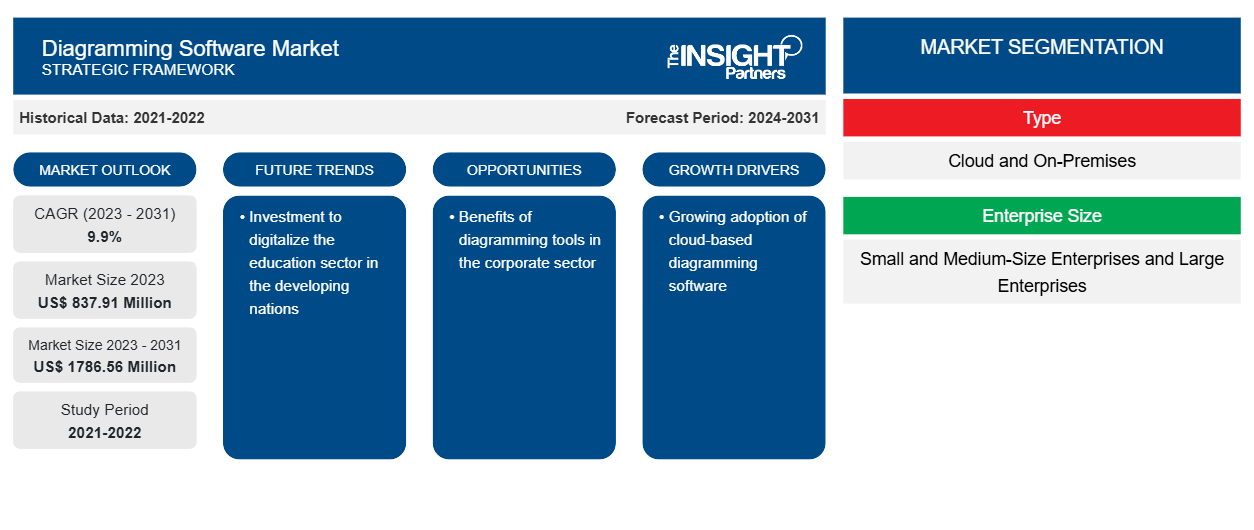
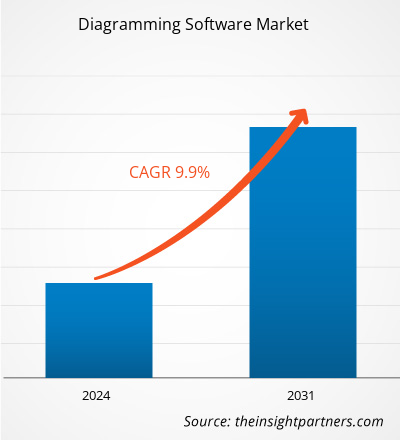
La taille du marché des logiciels de création de diagrammes devrait atteindre 1 786,56 millions de dollars américains d'ici 2031, contre 837,91 millions de dollars américains en 2023. Le marché devrait enregistrer un TCAC de 9,9 % au cours de la période 2023-2031. L'essor de la numérisation et l'adoption croissante des logiciels de création de diagrammes basés sur le cloud devraient rester des tendances clés du marché.
Analyse du marché des logiciels de création de diagrammes
Le marché des logiciels de création de diagrammes gagne du terrain en raison de l'adoption croissante des grandes entreprises et des petites et moyennes entreprises. L'adoption de ce logiciel les aide à mieux définir le flux de travail et le fonctionnement dans l' environnement commercial . Différents services de l'organisation tels que le marketing, les ressources humaines, l'ingénierie et les opérations peuvent l'utiliser largement.
Aperçu du marché des logiciels de création de diagrammes
Grâce à un logiciel de création de diagrammes, l'utilisateur peut créer des diagrammes détaillés, qui incluent des organigrammes, des diagrammes à secteurs, des plans d'étage et d'autres diagrammes, basés sur des ensembles de données et des images. Le logiciel de création de diagrammes comprend divers modèles qui aident l'utilisateur à créer le diagramme à partir de zéro. Ce logiciel peut facilement s'intégrer à d'autres outils et plateformes où plusieurs utilisateurs peuvent visualiser et contribuer à la création du diagramme.
Personnalisez ce rapport en fonction de vos besoins
Vous bénéficierez d'une personnalisation gratuite de n'importe quel rapport, y compris de certaines parties de ce rapport, d'une analyse au niveau des pays, d'un pack de données Excel, ainsi que d'offres et de remises exceptionnelles pour les start-ups et les universités.
Marché des logiciels de création de diagrammes : informations stratégiques
-
Obtenez les principales tendances clés du marché de ce rapport.Cet échantillon GRATUIT comprendra une analyse de données, allant des tendances du marché aux estimations et prévisions.
Moteurs et opportunités du marché des logiciels de création de diagrammes
Avantages des outils de création de diagrammes dans le secteur des entreprises
Les diagrammes aident à réduire la complexité de la communication. Dans l'environnement commercial, les diagrammes fournissent une représentation visuelle claire et concise des processus commerciaux. Ils aident à comprendre tous les employés concernant les objectifs et les processus à suivre dans la mise en œuvre du projet. Avec l'adoption d'outils de création de diagrammes, les chefs d'équipe ou les chefs de projet peuvent transmettre le flux de travail du projet à leurs employés, en l'expliquant à l'aide d'un diagramme. Les logiciels de création de diagrammes les aident à créer des diagrammes à secteurs, des organigrammes et plusieurs autres diagrammes basés sur des modèles. La représentation visuelle du projet ou des objectifs commerciaux aide les employés à mieux comprendre les tendances et la portée du projet. Par conséquent, les entreprises adoptent largement les logiciels de création de diagrammes.
Adoption de logiciels basés sur le cloud
En raison de l'essor des initiatives d'industrialisation et de mondialisation dans les pays développés et en développement, les activités commerciales se développent dans tous les secteurs. De plus, il a été observé que les entreprises adoptent la transformation numérique pour obtenir un avantage concurrentiel et maximiser leur productivité. Pour cela, les entreprises recherchent une solution rentable, ce qui conduit à l'adoption de la solution logicielle de création de diagrammes basée sur le cloud .
Analyse de segmentation du rapport sur le marché des logiciels de création de diagrammes
Les segments clés qui ont contribué à l’élaboration de l’analyse du marché des logiciels de création de diagrammes sont le type de déploiement, la taille de l’entreprise et l’application.
- En fonction du type de déploiement, le marché des logiciels de création de diagrammes est divisé en cloud et sur site. Le segment sur site détenait la plus grande part du marché en 2023.
- En fonction de la taille de l'entreprise, le marché est segmenté en petites et moyennes entreprises et en grandes entreprises. Le segment des petites et moyennes entreprises devrait connaître le TCAC le plus élevé.CAGR.
- En fonction de la taille de l'entreprise, le marché est segmenté en établissements d'enseignement, en entreprises et en personnel. Le segment des établissements d'enseignement détenait une part importante du marché en 2023.corporates, and personnel. The educational institutions segment held a significant share of the market in 2023.
Analyse des parts de marché des logiciels de création de diagrammes par zone géographique
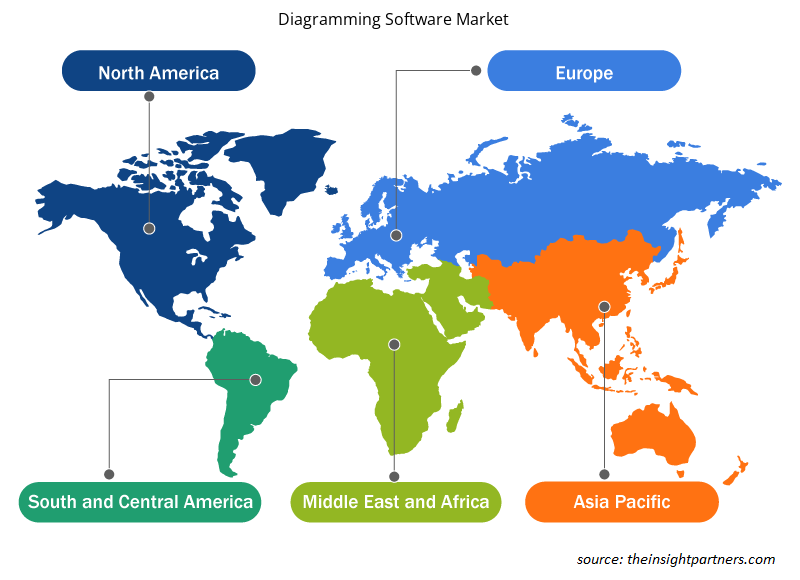
La portée géographique du rapport sur le marché des logiciels de création de diagrammes est principalement divisée en cinq régions : Amérique du Nord, Asie-Pacifique, Europe, Moyen-Orient et Afrique, et Amérique du Sud et centrale.
La région Asie-Pacifique détient la plus grande part de marché et devrait connaître le taux de croissance annuel composé le plus élevé. Des pays comme l'Inde, le Japon et la Chine détiennent la majorité des parts de marché de la région Asie-Pacifique. La numérisation croissante est l'un des principaux facteurs conduisant à l'adoption de solutions numériques. La croissance des plateformes d'apprentissage en ligne et des PME en pleine croissance dans les pays en développement favorise l'adoption de solutions logicielles de création de diagrammes.CAGR. Countries such as India, Japan, and China hold the majority of the Asia-Pacific market share. The growing digitalization is one of the major factors leading to the adoption of digital solutions. Growing e-learning platforms and growing SMEs in developing nations are driving the adoption of diagramming software solutions.
Aperçu régional du marché des logiciels de création de diagrammes
Les tendances et facteurs régionaux influençant le marché des logiciels de création de diagrammes tout au long de la période de prévision ont été expliqués en détail par les analystes d’Insight Partners. Cette section traite également des segments et de la géographie du marché des logiciels de création de diagrammes en Amérique du Nord, en Europe, en Asie-Pacifique, au Moyen-Orient et en Afrique, ainsi qu’en Amérique du Sud et en Amérique centrale.
- Obtenez les données régionales spécifiques au marché des logiciels de création de diagrammes
Portée du rapport sur le marché des logiciels de création de diagrammes
| Attribut de rapport | Détails |
|---|---|
| Taille du marché en 2023 | 837,91 millions de dollars américains |
| Taille du marché d'ici 2031 | 1 786,56 millions de dollars américains |
| Taux de croissance annuel composé mondial (2023-2031) | 9,9% |
| Données historiques | 2021-2022 |
| Période de prévision | 2024-2031 |
| Segments couverts |
Par type
|
| Régions et pays couverts |
Amérique du Nord
|
| Leaders du marché et profils d'entreprises clés |
|
Diagramme de la densité des acteurs du marché des logiciels : comprendre son impact sur la dynamique des entreprises
Le marché des logiciels de création de diagrammes connaît une croissance rapide, tirée par la demande croissante des utilisateurs finaux en raison de facteurs tels que l'évolution des préférences des consommateurs, les avancées technologiques et une plus grande sensibilisation aux avantages du produit. À mesure que la demande augmente, les entreprises élargissent leurs offres, innovent pour répondre aux besoins des consommateurs et capitalisent sur les tendances émergentes, ce qui alimente davantage la croissance du marché.
La densité des acteurs du marché fait référence à la répartition des entreprises ou des sociétés opérant sur un marché ou un secteur particulier. Elle indique le nombre de concurrents (acteurs du marché) présents sur un marché donné par rapport à sa taille ou à sa valeur marchande totale.
Les principales entreprises opérant sur le marché des logiciels de création de diagrammes sont :
- Créativement
- dessiner.io
- Gliffy par Perforce
- Logiciel Edrawsoft
- Lucidchart
- Microsoft
Avis de non-responsabilité : les sociétés répertoriées ci-dessus ne sont pas classées dans un ordre particulier.
- Obtenez un aperçu des principaux acteurs du marché des logiciels de création de diagrammes
Actualités et développements récents du marché des logiciels de création de diagrammes
Le marché des logiciels de création de diagrammes est évalué en collectant des données qualitatives et quantitatives après des recherches primaires et secondaires, qui comprennent d'importantes publications d'entreprise, des données d'association et des bases de données. Quelques-uns des développements du marché des logiciels de création de diagrammes sont répertoriés ci-dessous :
- Google a lancé le tout nouvel outil de création de diagrammes d'architecture Google Cloud. Cet outil permet à l'utilisateur de partager la vision avec l'équipe, de collaborer avec elle, d'itérer sur la conception et de créer la version finale qui répond le mieux aux exigences du cas d'utilisation métier. (Source : Google, communiqué de presse, février 2022)
- EdrawMax, un logiciel de création de diagrammes de premier plan, a lancé sa version mobile, l'application EdrawMax, conçue pour permettre aux utilisateurs de créer facilement des organigrammes et des diagrammes en blocs professionnels. Améliorant la productivité et faisant gagner du temps aux utilisateurs, la nouvelle application propose plus de 20 000 modèles de diagrammes de haute qualité que les utilisateurs peuvent personnaliser et modifier pour créer des diagrammes d'aspect soigné. (Source : PRNewswire, communiqué de presse, avril 2023)
Rapport sur le marché des logiciels de création de diagrammes et livrables
Le rapport « Taille et prévisions du marché des logiciels de création de diagrammes (2021-2031) » fournit une analyse détaillée du marché couvrant les domaines ci-dessous :
- Diagramme de la taille et des prévisions du marché des logiciels aux niveaux mondial, régional et national pour tous les segments de marché clés couverts par le champ d'application
- Diagramme des tendances du marché des logiciels, ainsi que de la dynamique du marché, comme les moteurs, les contraintes et les opportunités clés
- Analyse détaillée des cinq forces de PEST/Porter et SWOT
- Analyse du marché des logiciels de création de diagrammes couvrant les principales tendances du marché, le cadre mondial et régional, les principaux acteurs, les réglementations et les développements récents du marché
- Analyse du paysage industriel et de la concurrence couvrant la concentration du marché, l'analyse de la carte thermique, les principaux acteurs et les développements récents du marché des logiciels de création de diagrammes
- Profils d'entreprise détaillés

Ankita est une professionnelle dynamique des études de marché et du conseil, forte de plus de 8 ans d'expérience dans les secteurs des technologies, des médias, des TIC, de l'électronique et des semi-conducteurs. Elle a dirigé et réalisé avec succès plus de 100 missions de conseil et d'études pour des clients internationaux tels que Microsoft, Oracle, NEC Corporation, SAP, KPMG et Expeditors International. Ses compétences clés incluent l'analyse de marché, l'analyse de données, la prévision, la formulation de stratégies, la veille concurrentielle et la rédaction de rapports.
Ankita maîtrise parfaitement la gestion de cycles de projet complets, de la conception de propositions avant-vente et des discussions avec les clients jusqu'à la fourniture d'informations exploitables après-vente. Elle maîtrise la gestion d'équipes transverses, la structuration de modules d'études complexes et l'alignement des solutions sur les objectifs commerciaux spécifiques de chaque client. Ses excellentes compétences en communication, leadership et présentation lui ont permis de fournir systématiquement des résultats à forte valeur ajoutée dans des environnements de marché dynamiques et en constante évolution.
- Analyse historique (2 ans), année de base, prévision (7 ans) avec TCAC
- Analyse PEST et SWOT
- Taille du marché Valeur / Volume - Mondial, Régional, Pays
- Industrie et paysage concurrentiel
- Ensemble de données Excel
Témoignages
Le rapport sur le marché des systèmes SCADA d'Insight Partners est complet et fournit des informations précieuses sur les tendances actuelles et les prévisions. L'équipe a fait preuve d'un grand professionnalisme, d'une grande réactivité et d'un grand soutien tout au long du projet. Nous sommes très satisfaits et recommandons vivement leurs services.
RAN KEDEM Partenaire, Reali Technologies LTDJ'ai demandé un rapport sur un marché logiciel très spécifique et l'équipe l'a produit en quelques jours. Les informations étaient très pertinentes et bien présentées. J'ai ensuite demandé des modifications et des ajouts au rapport. L'équipe a de nouveau été très réactive et j'ai reçu le rapport final en moins d'une semaine.
JEAN-HERVÉ JENN Président, Future AnalyticaNous avons collaboré avec The Insight Partners pour une importante étude de marché et des prévisions. Ils nous ont fourni une vision claire des opportunités et des risques, ce qui nous a aidés à élaborer nos plans. Leurs recherches étaient faciles à utiliser et basées sur des données solides. Elles nous ont permis de prendre des décisions éclairées et en toute confiance. Nous les recommandons vivement.
PIYUSH NAGPAL Vice-président principal, Feux de route mondiauxInsight Partners a réalisé une étude de marché pertinente et bien structurée, avec une solide expertise du domaine. Son équipe a fait preuve de professionnalisme et de réactivité tout au long du projet. Son site web convivial a facilité l'accès aux rapports sectoriels. Nous recommandons vivement ses services d'études fiables et de haute qualité.
YUKIHIKO ADACHI PDG, Bleu profond, LLC.C'est la première fois que j'achète une étude de marché auprès de The Insight Partners. J'étais un peu hésitant au début, mais j'ai consulté leur site web et me suis senti plus à l'aise pour prendre le risque d'acheter une étude de marché. Je suis entièrement satisfait de la qualité du rapport et du service client. J'avais plusieurs questions et commentaires concernant le rapport initial, mais après quelques échanges par e-mail avec leur analyste, je pense avoir obtenu un rapport qui pourra alimenter notre processus de planification stratégique. Merci beaucoup pour votre temps et pour avoir rendu cette expérience positive. Je recommanderai sans hésiter vos services et vous serez mon premier contact lorsque nous aurons besoin de données de marché supplémentaires.
JOHN SUZUKI Président-directeur général, administrateur du conseil d'administration, BK TechnologiesJe tiens à vous remercier pour votre soutien et le professionnalisme dont vous avez fait preuve lors du traitement de ma demande d'informations concernant le marché des dispositifs de diagnostic in vitro (DIV) pour les maladies infectieuses au Nigéria. J'apprécie votre patience, vos conseils et votre volonté d'offrir une réduction, ce qui nous a finalement permis de conclure un accord. Je me réjouis de collaborer à nouveau avec The Insight Partners, grâce à l'impression que vous m'avez laissée suite à cette première rencontre.
DR CHIJIOKE DIRECTEUR GÉNÉRAL D'ONYIA, PineCrest Healthcare Ltd.Raison d'acheter
- Prise de décision éclairée
- Compréhension de la dynamique du marché
- Analyse concurrentielle
- Connaissances clients
- Prévisions de marché
- Atténuation des risques
- Planification stratégique
- Justification des investissements
- Identification des marchés émergents
- Amélioration des stratégies marketing
- Amélioration de l'efficacité opérationnelle
- Alignement sur les tendances réglementaires


Débloquez des remises exclusives sur les rapports
Demander maintenant


 Obtenez un échantillon gratuit pour - Marché des logiciels de création de diagrammes