ダイアグラム作成ソフトウェア市場の分析と予測 - 規模、シェア、成長、トレンド 2031 年
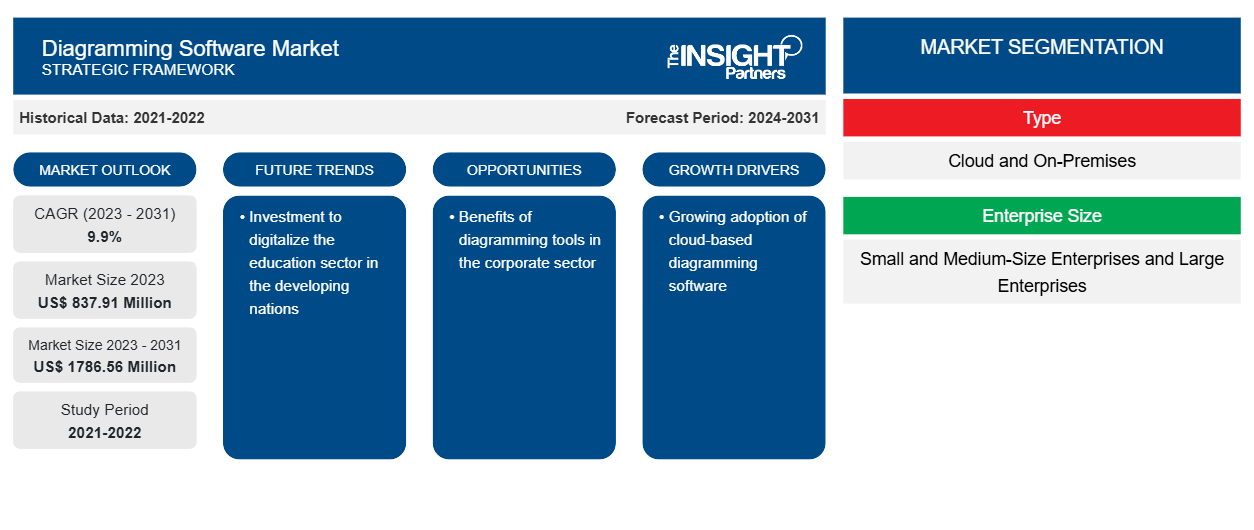
過去データ : 2021-2022 | 基準年 : 2023 | 予測期間 : 2024-2031ダイアグラム作成ソフトウェア市場の規模と予測(2021年 - 2031年)、世界および地域のシェア、傾向、成長機会分析レポートの対象範囲:展開タイプ(クラウドおよびオンプレミス)、企業規模(中小企業および大企業)、アプリケーション(教育機関、法人、個人)、および地域別
- ステータス : 公開されたデータ
- レポートコード : TIPRE00011177
- カテゴリー : テクノロジー、メディア、通信
- ページ数 : 150
- 利用可能なレポート形式 :


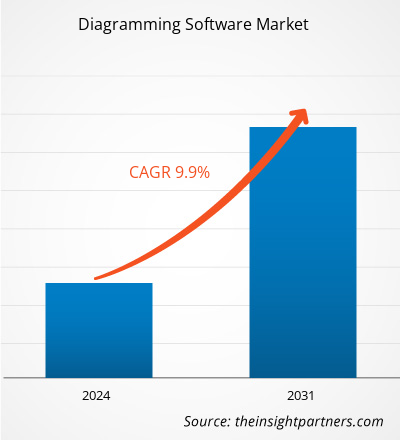
ダイアグラム作成ソフトウェアの市場規模は、2023 年の 8 億 3,791 万米ドルから 2031 年には 1 億 7,8656 万米ドルに達すると予測されています。市場は 2023 年から 2031 年にかけて 9.9% の CAGR を記録すると予想されています。デジタル化の進展とクラウドベースのダイアグラム作成ソフトウェアの採用拡大は、今後も市場の主要なトレンドであり続けると思われます。
ダイアグラム作成ソフトウェア市場分析
大企業や中小企業での導入が増えているため、ダイアグラム作成ソフトウェア市場は勢いを増しています。このソフトウェアを導入することで、ビジネス環境におけるワークフローと操作をより適切に定義できるようになります。マーケティング、人事、エンジニアリング、運用など、組織のさまざまな部門で幅広く使用できます。
ダイアグラム作成ソフトウェア市場の概要
ダイアグラム作成ソフトウェアを使用すると、データセットや画像に基づいて、フローチャート、円グラフ、フロアプラン、その他の図を含む詳細なダイアグラムを作成できます。ダイアグラム作成ソフトウェアには、ユーザーが最初からダイアグラムを作成するのに役立つさまざまなテンプレートが含まれています。このソフトウェアは、他のツールやプラットフォームと簡単に統合でき、複数のユーザーがダイアグラムを表示して作成に参加できます。
要件に合わせてレポートをカスタマイズする
このレポートの一部、国レベルの分析、Excelデータパックなど、あらゆるレポートを無料でカスタマイズできます。また、スタートアップや大学向けのお得なオファーや割引もご利用いただけます。
ダイアグラム作成ソフトウェア市場:戦略的洞察
-
このレポートの主要な市場動向を入手してください。この無料サンプルには、市場動向から見積もりや予測に至るまでのデータ分析が含まれます。
ダイアグラム作成ソフトウェア市場の推進要因と機会
企業部門におけるダイアグラム作成ツールの利点
図はコミュニケーションの複雑さを軽減するのに役立ちます。ビジネス環境では、図はビジネス プロセスを明確かつ簡潔に視覚的に表現します。これは、プロジェクトの実装で従う必要のある目標とプロセスに関して、すべての従業員の理解に役立ちます。図作成ツールを導入することで、チーム リーダーまたはプロジェクト マネージャーは、図を使用して説明しながら、プロジェクトのワークフローを従業員に提供できます。図作成ソフトウェアは、円グラフ、フロー チャート、およびその他のいくつかのテンプレート化された図を作成するのに役立ちます。プロジェクトまたはビジネス目標を視覚的に表現することで、従業員はプロジェクトの傾向と範囲をよりよく理解できます。そのため、企業は図作成ソフトウェアを広く導入しています。
クラウドベースのソフトウェアの導入
先進国と発展途上国の両方で工業化とグローバル化の取り組みが進んでいるため、すべての業界でビジネス活動が拡大しています。さらに、企業が競争上の優位性を獲得し、生産性を最大化するためにデジタル変革を採用していることが観察されています。このため、企業はコスト効率の高いソリューションを求めており、クラウドベースのダイアグラム作成ソフトウェアソリューションの採用につながっています。
ダイアグラム作成ソフトウェア市場レポートのセグメンテーション分析
ダイアグラム作成ソフトウェア市場分析の導出に貢献した主要なセグメントは、展開タイプ、企業規模、およびアプリケーションです。
- 展開タイプに基づいて、ダイアグラム作成ソフトウェア市場はクラウドとオンプレミスに分かれています。オンプレミスセグメントは2023年に市場で最大のシェアを占めました。
- 企業規模別に見ると、市場は中小企業と大企業に分かれています。中小企業セグメントは最も高い CAGR で成長すると予想されています。
- 企業規模別に見ると、市場は教育機関、法人、および個人に分類されます。教育機関セグメントは、2023 年に市場の大きなシェアを占めました。
地域別のダイアグラム作成ソフトウェア市場シェア分析
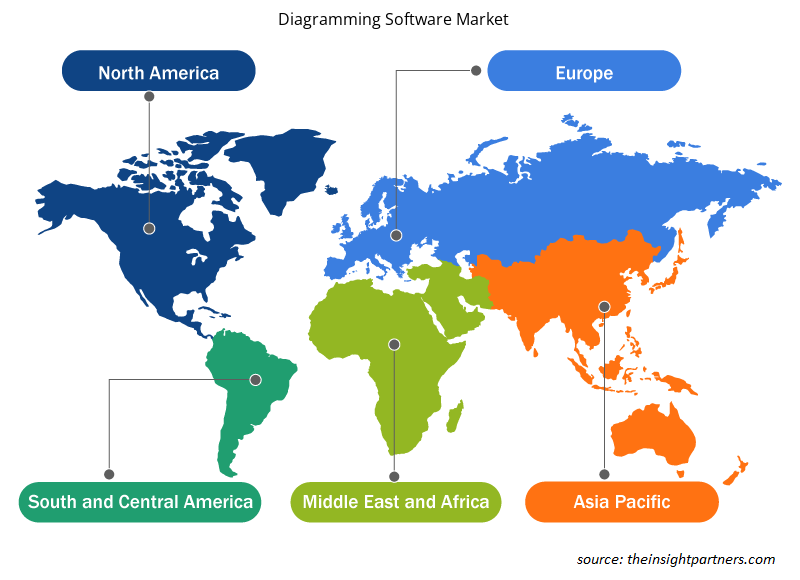
ダイアグラム作成ソフトウェア市場レポートの地理的範囲は、主に北米、アジア太平洋、ヨーロッパ、中東およびアフリカ、南米および中米の 5 つの地域に分かれています。
アジア太平洋地域は最大の市場シェアを占めており、最高の CAGR で成長すると予想されています。インド、日本、中国などの国がアジア太平洋市場のシェアの大部分を占めています。デジタル化の進展は、デジタル ソリューションの採用につながる主な要因の 1 つです。e ラーニング プラットフォームの拡大と発展途上国における中小企業の増加が、ダイアグラム作成ソフトウェア ソリューションの採用を促進しています。
ダイアグラム作成ソフトウェア市場の地域別分析
予測期間を通じてダイアグラム作成ソフトウェア市場に影響を与える地域的な傾向と要因は、Insight Partners のアナリストによって徹底的に説明されています。このセクションでは、北米、ヨーロッパ、アジア太平洋、中東およびアフリカ、南米および中米にわたるダイアグラム作成ソフトウェア市場のセグメントと地理についても説明します。
- ダイアグラム作成ソフトウェア市場の地域別データを入手
ダイアグラム作成ソフトウェア市場レポートの範囲
| レポート属性 | 詳細 |
|---|---|
| 2023年の市場規模 | 8億3,791万米ドル |
| 2031年までの市場規模 | 17億8,656万米ドル |
| 世界のCAGR(2023年~2031年) | 9.9% |
| 履歴データ | 2021-2022 |
| 予測期間 | 2024-2031 |
| 対象セグメント |
タイプ別
|
| 対象地域と国 |
北米
|
| 市場リーダーと主要企業プロフィール |
|
ソフトウェア市場のプレーヤー密度の図解:ビジネスダイナミクスへの影響を理解する
ダイアグラム作成ソフトウェア市場は、消費者の嗜好の変化、技術の進歩、製品の利点に対する認識の高まりなどの要因により、エンドユーザーの需要が高まり、急速に成長しています。需要が高まるにつれて、企業は提供内容を拡大し、消費者のニーズを満たすために革新し、新たなトレンドを活用し、市場の成長をさらに促進しています。
市場プレーヤー密度とは、特定の市場または業界内で活動している企業または会社の分布を指します。これは、特定の市場スペースに、その市場規模または総市場価値に対してどれだけの競合相手 (市場プレーヤー) が存在するかを示します。
ダイアグラム作成ソフトウェア市場で事業を展開している主要企業は次のとおりです。
- クリエイティヴ
- ドロー.io
- Gliffy の Perforce
- エドローソフト
- ルシチャート
- マイクロソフト
免責事項:上記の企業は、特定の順序でランク付けされていません。
- ダイアグラム作成ソフトウェア市場のトップキープレーヤーの概要を入手
ダイアグラム作成ソフトウェア市場のニュースと最近の動向
ダイアグラム作成ソフトウェア市場は、主要な企業出版物、協会データ、データベースなどの一次調査と二次調査後の定性的および定量的データを収集することによって評価されます。ダイアグラム作成ソフトウェア市場におけるいくつかの開発を次に示します。
- Google は、まったく新しい Google Cloud アーキテクチャ ダイアグラム ツールをリリースしました。このツールを使用すると、ユーザーはチームとビジョンを共有し、チームと連携して設計を繰り返し、ビジネス ユースケースの要件に最適な最終バージョンを作成できます。(出典: Google、プレスリリース、2022 年 2 月)
- 大手ダイアグラム作成ソフトウェアの EdrawMax は、ユーザーがプロフェッショナルなフローチャートやブロック図を簡単に作成できるモバイル版 EdrawMax アプリをリリースしました。生産性を向上させ、ユーザーの時間を節約するこの新しいアプリは、ユーザーがカスタマイズや変更して洗練されたダイアグラムを作成できる 20,000 を超える高品質のダイアグラム テンプレートを提供します。(出典: PRNewswire、プレスリリース、2023 年 4 月)
ダイアグラム作成ソフトウェア市場レポートの対象範囲と成果物
「ダイアグラム作成ソフトウェア市場の規模と予測(2021〜2031年)」レポートでは、以下の分野をカバーする市場の詳細な分析を提供しています。
- 対象範囲に含まれるすべての主要市場セグメントについて、世界、地域、国レベルでソフトウェア市場の規模と予測を図式化します。
- ソフトウェア市場の動向、および推進要因、制約、主要な機会などの市場動向を図式化する
- 詳細なPEST/ポーターの5つの力とSWOT分析
- 主要な市場動向、世界および地域の枠組み、主要プレーヤー、規制、最近の市場動向を網羅した図表ソフトウェア市場分析
- 市場集中、ヒートマップ分析、主要プレーヤー、ダイアグラム作成ソフトウェア市場の最近の動向を網羅した業界の状況と競争分析
- 詳細な企業プロフィール

アンキタは、テクノロジー、メディア、ICT、エレクトロニクス・半導体の各分野で8年以上の経験を持つ、ダイナミックな市場調査およびコンサルティングのプロフェッショナルです。Microsoft、Oracle、NEC、SAP、KPMG、Expeditors Internationalといったグローバルクライアントに対し、100件以上のコンサルティングおよび調査案件を主導・遂行してきました。彼女のコアコンピテンシーは、市場評価、データ分析、予測、戦略策定、競合情報、レポート作成です。
アンキタは、販売前の提案書作成やクライアントとの協議から、販売後の実用的なインサイトの提供まで、プロジェクトサイクル全体を巧みに管理することに長けています。彼女は、部門横断的なチームの管理、複雑な調査モジュールの構築、そしてクライアント固有のビジネス目標に合わせたソリューションの調整に長けています。優れたコミュニケーション能力、リーダーシップ、そしてプレゼンテーション能力により、急速に変化する市場環境において、常に価値主導の成果を生み出しています。
- 過去2年間の分析、基準年、CAGRによる予測(7年間)
- PEST分析とSWOT分析
- 市場規模価値/数量 - 世界、地域、国
- 業界と競争環境
- Excel データセット
お客様の声
Insight PartnersのSCADAシステム市場レポートは包括的で、現在のトレンドと将来の予測に関する貴重な洞察が含まれています。チームは終始、非常にプロフェッショナルで、対応が早く、サポートも充実していました。私たちは彼らのサービスに非常に満足しており、強くお勧めします。
ラン・ケデム パートナー, レアリテクノロジーズ株式会社非常に特殊なソフトウェア市場に関するレポートを依頼したところ、チームは数日でレポートを作成してくれました。情報は非常に関連性が高く、分かりやすくまとめられていました。その後、レポートにいくつか修正と追加を依頼しましたが、チームは非常に迅速に対応し、1週間も経たないうちに最終レポートを受け取ることができました。
ジャン=エルヴェ・ジェン 会長, フューチャー・アナリティカ重要な市場調査と予測のために、The Insight Partnersと協力しました。彼らは機会とリスクに関する明確な洞察を提供し、私たちの計画策定に役立ちました。彼らの調査は使いやすく、確かなデータに基づいており、賢明で自信に満ちた意思決定に役立ちました。彼らを強くお勧めします。
ピユーシュ・ナグパル 上級副社長, ハイビームグローバルInsight Partnersは、深い専門知識に基づき、洞察力に富み、構造化された市場調査を提供しました。チームは終始プロフェッショナルで、対応力も抜群でした。ユーザーフレンドリーなウェブサイトにより、業界レポートへのアクセスもスムーズでした。信頼性の高い高品質な調査サービスをお探しなら、Insight Partnersを強くお勧めします。
安達幸彦 最高経営責任者(CEO), ディープブルーLLC。The Insight Partnersから市場レポートを購入するのは今回が初めてです。最初は不安でしたが、ウェブサイトを見て、リスクを負ってでも購入してみようという気持ちになりました。レポートの品質とカスタマーサービスには大変満足しています。最初のレポートにはいくつか質問やコメントがありましたが、アナリストとメールで何度かやり取りした結果、戦略策定プロセスへのインプットとして活用できるレポートが完成しました。貴重なお時間を割いていただき、貴重な体験をさせていただき、誠にありがとうございました。他の方にもぜひお勧めしたいですし、今後さらに市場データが必要になった際には、まずThe Insight Partnersにご連絡させていただきます。
ジョン・スズキ 社長兼最高経営責任者、取締役, BKテクノロジーズナイジェリアの感染症IVD市場に関する情報提供依頼に対し、ご対応いただいた際、ご尽力とプロフェッショナルな姿勢に深く感謝申し上げます。忍耐強く、的確なアドバイスをいただき、また、最終的に取引成立に至った割引のご提供にも深く感謝申し上げます。今回の最初の出会いで得た強い印象のおかげで、今後もThe Insight Partnersとの連携を心待ちにしております。
チジオケ博士 オニア マネージングディレクター, パインクレストヘルスケア株式会社購入理由
- 情報に基づいた意思決定
- 市場動向の理解
- 競合分析
- 顧客インサイト
- 市場予測
- リスク軽減
- 戦略計画
- 投資の正当性
- 新興市場の特定
- マーケティング戦略の強化
- 業務効率の向上
- 規制動向への対応


 無料サンプルを入手 - ダイアグラム作成ソフトウェア市場