Análisis y pronóstico del mercado de software de diagramación por tamaño, participación, crecimiento y tendencias para 2031
Datos históricos : 2021-2022 | Año base : 2023 | Período de pronóstico : 2024-2031Tamaño y pronóstico del mercado de software de diagramación (2021-2031), participación global y regional, tendencias y análisis de oportunidades de crecimiento. Cobertura del informe: por tipo de implementación (nube y local), tamaño de la empresa (pequeñas y medianas empresas y grandes empresas), aplicación (instituciones educativas, corporaciones y particulares) y geografía.
- Estado : Datos publicados
- Código de informe : TIPRE00011177
- Categoría : Tecnología, medios y telecomunicaciones
- Número de páginas : 150
- Formatos de informe disponibles :


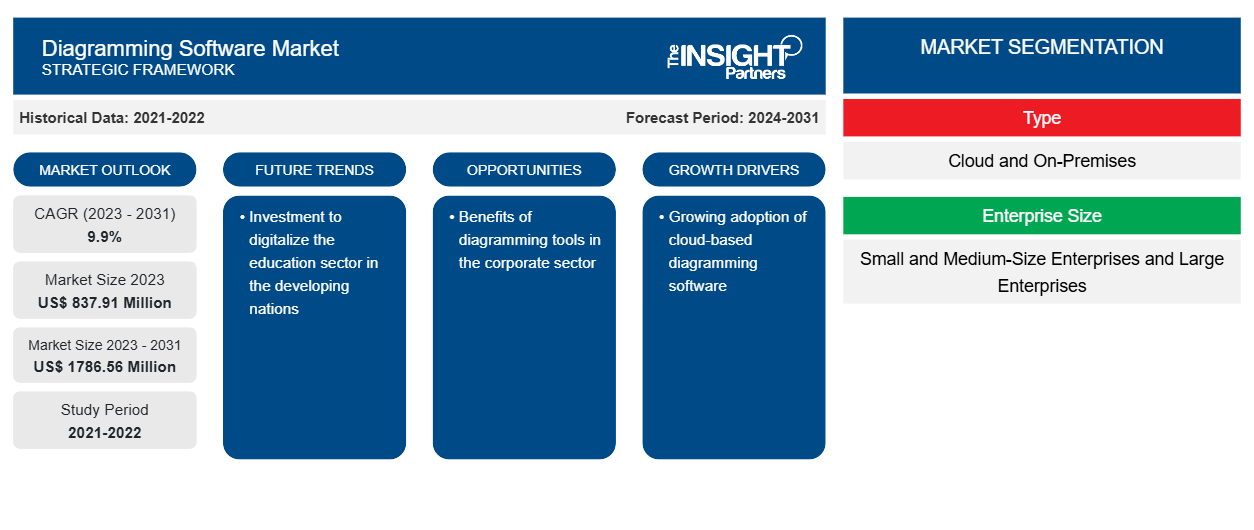
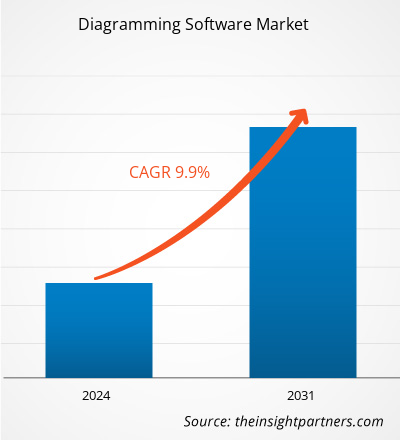
Se proyecta que el tamaño del mercado de software de diagramación alcance los 1786,56 millones de dólares estadounidenses en 2031, frente a los 837,91 millones de dólares estadounidenses en 2023. Se espera que el mercado registre una CAGR del 9,9 % durante el período 2023-2031. Es probable que el aumento de la digitalización y la creciente adopción de software de diagramación basado en la nube sigan siendo tendencias clave en el mercado.
Análisis del mercado de software de diagramación
El mercado de software de diagramación está ganando terreno debido a la creciente adopción por parte de grandes empresas y pequeñas y medianas empresas. La adopción de este software les ayuda a definir mejor el flujo de trabajo y el funcionamiento en el entorno empresarial . Varios departamentos de la organización, como marketing, recursos humanos, ingeniería y operaciones, pueden utilizarlo ampliamente.
Descripción general del mercado de software de diagramación
Con la ayuda del software de diagramación, el usuario puede crear diagramas detallados, que incluyen diagramas de flujo, gráficos circulares, planos de planta y otros diagramas, basados en conjuntos de datos e imágenes. El software de diagramación incluye varias plantillas que ayudan al usuario a crear el diagrama desde cero. Este software se puede integrar fácilmente con otras herramientas y plataformas donde varios usuarios pueden ver y contribuir a la creación del diagrama.
Personalice este informe según sus necesidades
Obtendrá personalización en cualquier informe, sin cargo, incluidas partes de este informe o análisis a nivel de país, paquete de datos de Excel, así como también grandes ofertas y descuentos para empresas emergentes y universidades.
Mercado de software de diagramación: perspectivas estratégicas
-
Obtenga las principales tendencias clave del mercado de este informe.Esta muestra GRATUITA incluirá análisis de datos, desde tendencias del mercado hasta estimaciones y pronósticos.
Impulsores y oportunidades del mercado del software de diagramación
Beneficios de las herramientas de diagramación en el sector corporativo
Los diagramas ayudan a reducir la complejidad de la comunicación. En el entorno empresarial, los diagramas proporcionan una representación visual clara y concisa de los procesos empresariales. Ayudan a que todos los empleados comprendan los objetivos y procesos que deben seguirse en la implementación del proyecto. Con la adopción de herramientas de diagramación, los líderes de equipo o los gerentes de proyecto pueden entregar el flujo de trabajo del proyecto a sus empleados, explicándolo con un diagrama. El software de diagramación les ayuda a crear gráficos circulares, diagramas de flujo y varios otros diagramas con plantillas. La representación visual del proyecto o los objetivos empresariales ayuda a los empleados a comprender mejor las tendencias y el alcance del proyecto. Por lo tanto, las empresas están adoptando ampliamente el software de diagramación.
Adopción de software basado en la nube
Debido al aumento de las iniciativas de industrialización y globalización tanto en los países desarrollados como en los países en desarrollo, las actividades comerciales están creciendo en todas las industrias. Además, se ha observado que las empresas están adoptando la transformación digital para obtener una ventaja competitiva y maximizar su productividad. Para ello, las empresas buscan una solución rentable, lo que las está llevando a la adopción de la solución de software de diagramación basada en la nube .
Informe de mercado de software de diagramación Análisis de segmentación
Los segmentos clave que contribuyeron a la derivación del análisis del mercado de software de diagramación son el tipo de implementación, el tamaño de la empresa y la aplicación.
- Según el tipo de implementación, el mercado de software de diagramación se divide en nube y local. El segmento local tuvo la mayor participación del mercado en 2023.
- Por tamaño de empresa, el mercado se segmenta en pequeñas y medianas empresas y grandes empresas. Se espera que el segmento de pequeñas y medianas empresas crezca con la CAGR más alta.CAGR.
- Por tamaño de empresa, el mercado se segmenta en instituciones educativas, corporaciones y personal. El segmento de instituciones educativas tuvo una participación significativa del mercado en 2023.corporates, and personnel. The educational institutions segment held a significant share of the market in 2023.
Análisis de la cuota de mercado del software de diagramación por geografía
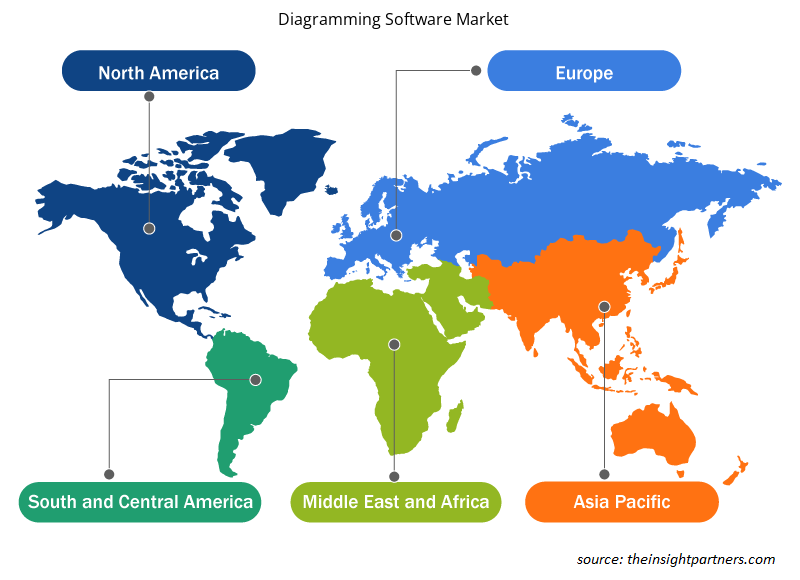
El alcance geográfico del informe de mercado de software de diagramación se divide principalmente en cinco regiones: América del Norte, Asia Pacífico, Europa, Medio Oriente y África, y América del Sur y Central.
La región de Asia Pacífico tuvo la mayor participación de mercado y se espera que crezca con la CAGR más alta. Países como India, Japón y China tienen la mayor parte de la participación de mercado de Asia Pacífico. La creciente digitalización es uno de los principales factores que conducen a la adopción de soluciones digitales. El crecimiento de las plataformas de aprendizaje electrónico y el crecimiento de las pymes en los países en desarrollo están impulsando la adopción de soluciones de software de diagramación.CAGR. Countries such as India, Japan, and China hold the majority of the Asia-Pacific market share. The growing digitalization is one of the major factors leading to the adoption of digital solutions. Growing e-learning platforms and growing SMEs in developing nations are driving the adoption of diagramming software solutions.
Perspectivas regionales del mercado de software de diagramación
Los analistas de Insight Partners explicaron en detalle las tendencias y los factores regionales que influyen en el mercado de software de diagramación durante el período de pronóstico. Esta sección también analiza los segmentos y la geografía del mercado de software de diagramación en América del Norte, Europa, Asia Pacífico, Oriente Medio y África, y América del Sur y Central.
- Obtenga datos regionales específicos para el mercado de software de diagramación
Alcance del informe de mercado de software de diagramación
| Atributo del informe | Detalles |
|---|---|
| Tamaño del mercado en 2023 | US$ 837,91 millones |
| Tamaño del mercado en 2031 | US$ 1786,56 millones |
| CAGR global (2023 - 2031) | 9,9% |
| Datos históricos | 2021-2022 |
| Período de pronóstico | 2024-2031 |
| Segmentos cubiertos |
Por tipo
|
| Regiones y países cubiertos |
América del norte
|
| Líderes del mercado y perfiles de empresas clave |
|
Diagrama de densidad de actores del mercado de software: comprensión de su impacto en la dinámica empresarial
El mercado de software de diagramación está creciendo rápidamente, impulsado por la creciente demanda de los usuarios finales debido a factores como la evolución de las preferencias de los consumidores, los avances tecnológicos y una mayor conciencia de los beneficios del producto. A medida que aumenta la demanda, las empresas amplían sus ofertas, innovan para satisfacer las necesidades de los consumidores y aprovechan las tendencias emergentes, lo que impulsa aún más el crecimiento del mercado.
La densidad de actores del mercado se refiere a la distribución de las empresas o firmas que operan dentro de un mercado o industria en particular. Indica cuántos competidores (actores del mercado) están presentes en un espacio de mercado determinado en relación con su tamaño o valor total de mercado.
Las principales empresas que operan en el mercado de software de diagramación son:
- Creativamente
- dibujar.io
- Gliffy de Perforce
- Edrawsoft
- Diagrama lúcido
- Microsoft
Descargo de responsabilidad : Las empresas enumeradas anteriormente no están clasificadas en ningún orden particular.
- Obtenga una descripción general de los principales actores clave del mercado de software de diagramación
Noticias y desarrollos recientes del mercado de software de diagramación
El mercado de software de diagramación se evalúa mediante la recopilación de datos cualitativos y cuantitativos a partir de una investigación primaria y secundaria, que incluye publicaciones corporativas importantes, datos de asociaciones y bases de datos. A continuación, se enumeran algunos de los avances en el mercado de software de diagramación:
- Google lanzó la nueva herramienta de diagramación de arquitectura de Google Cloud. Esta herramienta permite al usuario compartir la visión con el equipo, colaborar con ellos, iterar sobre el diseño y crear la versión final que mejor se adapte a los requisitos del caso de uso comercial. (Fuente: Google, comunicado de prensa, febrero de 2022)
- EdrawMax, un software de diagramación líder, lanzó su versión móvil, la aplicación EdrawMax, que está diseñada para permitir a los usuarios crear diagramas de flujo y diagramas de bloques profesionales con facilidad. Para mejorar la productividad y ahorrar tiempo a los usuarios, la nueva aplicación ofrece más de 20 000 plantillas de diagramas de alta calidad que los usuarios pueden personalizar y modificar para crear diagramas de aspecto impecable. (Fuente: PRNewswire, comunicado de prensa, abril de 2023)
Informe de mercado sobre software de diagramación: cobertura y resultados
El informe "Tamaño y pronóstico del mercado de software de diagramación (2021-2031)" proporciona un análisis detallado del mercado que cubre las siguientes áreas:
- Diagrama del tamaño del mercado de software y pronóstico a nivel global, regional y nacional para todos los segmentos clave del mercado cubiertos bajo el alcance
- Diagramar las tendencias del mercado de software, así como la dinámica del mercado, como impulsores, restricciones y oportunidades clave.
- Análisis detallado de las cinco fuerzas de Porter y PEST y FODA
- Análisis del mercado de software de diagramación que abarca las tendencias clave del mercado, el marco global y regional, los principales actores, las regulaciones y los desarrollos recientes del mercado.
- Análisis del panorama de la industria y de la competencia que abarca la concentración del mercado, el análisis de mapas de calor, los actores destacados y los desarrollos recientes del mercado de software de diagramación
- Perfiles detallados de empresas

Ankita es una profesional dinámica en investigación de mercados y consultoría con más de 8 años de experiencia en los sectores de tecnología, medios de comunicación, TIC, electrónica y semiconductores. Ha liderado y ejecutado con éxito más de 100 proyectos de consultoría e investigación para clientes globales como Microsoft, Oracle, NEC Corporation, SAP, KPMG y Expeditors International. Sus principales competencias incluyen la evaluación de mercado, el análisis de datos, la previsión, la formulación de estrategias, la inteligencia competitiva y la redacción de informes.
Ankita es experta en la gestión de ciclos completos de proyecto, desde el diseño de propuestas de preventa y las conversaciones con los clientes hasta la entrega de información práctica posventa. Es experta en la gestión de equipos multifuncionales, la estructuración de módulos de investigación complejos y la alineación de soluciones con los objetivos de negocio específicos del cliente. Sus excelentes habilidades de comunicación, liderazgo y presentación le han permitido obtener constantemente resultados orientados al valor en entornos de mercado dinámicos y en constante evolución.
- Análisis histórico (2 años), año base, pronóstico (7 años) con CAGR
- Análisis PEST y FODA
- Tamaño del mercado, valor/volumen: global, regional y nacional
- Industria y panorama competitivo
- Conjunto de datos de Excel
Testimonios
El informe de mercado de sistemas SCADA de Insight Partners es completo y ofrece información valiosa sobre las tendencias actuales y las previsiones futuras. El equipo fue altamente profesional, receptivo y me brindó un gran apoyo en todo momento. Estamos muy satisfechos y recomendamos ampliamente sus servicios.
RAN KEDEM Socio, Reali Technologies LTDsSolicité un informe sobre un mercado de software muy específico y el equipo lo elaboró en pocos días. La información era muy relevante y estaba bien presentada. Posteriormente, solicité algunos cambios y adiciones al informe. El equipo fue muy receptivo y recibí el informe final en menos de una semana.
JEAN-HERVE JENN Presidente, Future AnalyticaTrabajamos con The Insight Partners para un importante estudio y pronóstico de mercado. Nos brindaron una visión clara de las oportunidades y los riesgos, lo que nos ayudó a definir nuestros planes. Su investigación fue fácil de usar y se basó en datos sólidos. Nos ayudó a tomar decisiones inteligentes y seguras. Los recomendamos ampliamente.
PIYUSH NAGPAL Vicepresidente Sénior, , High Beam GlobalThe Insight Partners realizó una investigación de mercado profunda y bien estructurada con una sólida experiencia en el sector. Su equipo fue profesional y receptivo en todo momento. El sitio web, fácil de usar, facilitó el acceso a los informes del sector. Los recomendamos ampliamente por sus servicios de investigación confiables y de alta calidad.
YUKIHIKO ADACHI Director Ejecutivo, , Deep Blue, LLCEsta es la primera vez que compro un informe de mercado de The Insight Partners. Aunque al principio tenía dudas, visité su sitio web y me sentí más cómodo al arriesgarme y comprarlo. Estoy completamente satisfecho con la calidad del informe y el servicio al cliente. Tenía varias preguntas y comentarios sobre el informe inicial, pero después de un par de conversaciones por correo electrónico con su analista, creo que tengo un informe que puedo usar como base para nuestro proceso de planificación estratégica. Muchas gracias por tomarse el tiempo y hacer de esta una experiencia positiva. Sin duda, recomendaré sus servicios y serán mi primera opción cuando necesitemos más datos de mercado.
JOHN SUZUKI Presidente y Director Ejecutivo, Director de la Junta Directiva, BK TechnologiesAgradezco su apoyo y la profesionalidad que demostraron al atender mi solicitud de información sobre el mercado de diagnóstico in vitro (IVD) para enfermedades infecciosas en Nigeria. Agradezco su paciencia, su orientación y su disposición a ofrecerme un descuento, lo que finalmente nos permitió cerrar un trato. Espero poder colaborar con The Insight Partners en el futuro, gracias a la impresión que me causó este primer encuentro.
DRA. CHIJIOKE ONYIA, DIRECTORA GENERAL, PineCrest Healthcare Ltd.Razón para comprar
- Toma de decisiones informada
- Comprensión de la dinámica del mercado
- Análisis competitivo
- Información sobre clientes
- Pronósticos del mercado
- Mitigación de riesgos
- Planificación estratégica
- Justificación de la inversión
- Identificación de mercados emergentes
- Mejora de las estrategias de marketing
- Impulso de la eficiencia operativa
- Alineación con las tendencias regulatorias


Desbloquea descuentos exclusivos en informes
Consultar ahora


 Obtenga una muestra gratuita para - Mercado de software de diagramación