Analisi e previsioni del mercato del software per diagrammi per dimensioni, quota, crescita, tendenze 2031
Dati storici : 2021-2022 | Anno base : 2023 | Periodo di previsione : 2024-2031Dimensioni e previsioni del mercato del software di creazione di diagrammi (2021-2031), quota globale e regionale, trend e opportunità di crescita. Copertura del rapporto di analisi: per tipo di distribuzione (cloud e on-premise), dimensioni aziendali (piccole e medie imprese e grandi imprese), applicazione (istituti scolastici, aziende e privati) e area geografica.
- Stato : Dati rilasciati
- Codice del report : TIPRE00011177
- Categoria : Tecnologia, media e telecomunicazioni
- Numero di pagine : 150
- Formati di report disponibili :


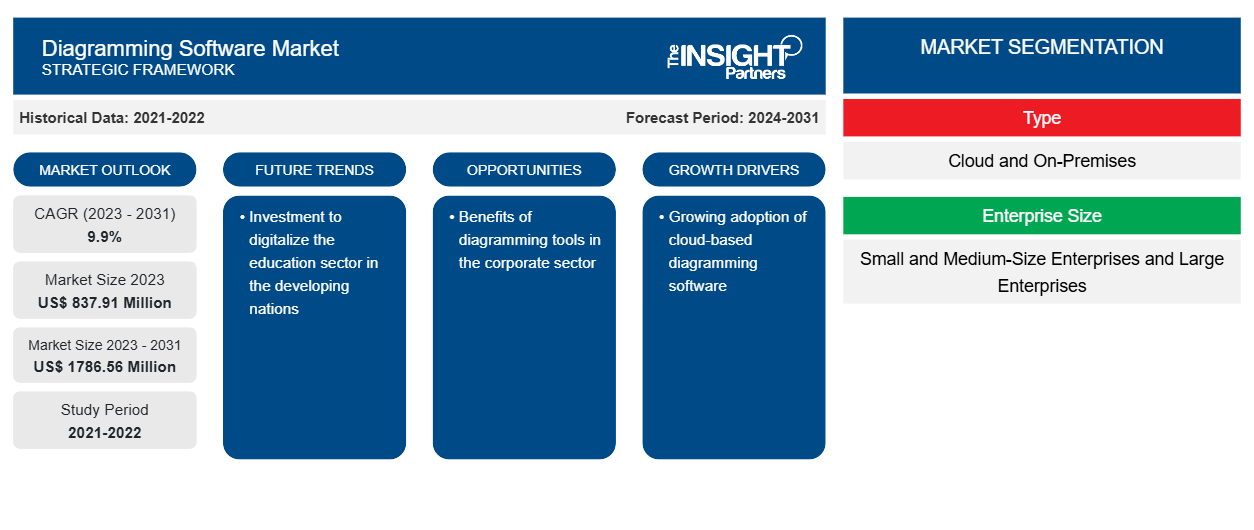
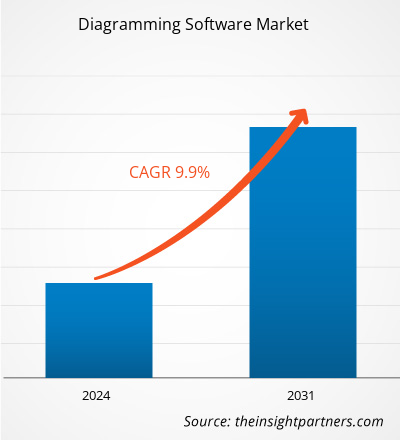
Si prevede che la dimensione del mercato del software di diagrammazione raggiungerà 1786,56 milioni di dollari entro il 2031, rispetto agli 837,91 milioni di dollari del 2023. Si prevede che il mercato registrerà un CAGR del 9,9% nel periodo 2023-2031. L'aumento della digitalizzazione e la crescente adozione di software di diagrammazione basati su cloud rimarranno probabilmente tendenze chiave nel mercato.
Analisi di mercato del software di diagrammazione
Il mercato dei software di diagrammazione sta guadagnando terreno grazie alla crescente adozione da parte di grandi aziende e piccole e medie imprese. L'adozione di questo software li aiuta a definire meglio il flusso di lavoro e le operazioni nell'ambiente aziendale . Vari dipartimenti dell'organizzazione, come marketing, risorse umane, ingegneria e operazioni, possono utilizzarlo ampiamente.
Panoramica del mercato del software di diagrammi
Con l'aiuto del software di diagrammazione, l'utente può creare diagrammi dettagliati, che includono diagrammi di flusso, grafici a torta, planimetrie e altri diagrammi, basati su set di dati e immagini. Il software di diagrammazione include vari modelli che aiutano l'utente a creare il diagramma da zero. Questo software può essere facilmente integrato con altri strumenti e piattaforme in cui più utenti possono visualizzare e contribuire alla creazione del diagramma.
Personalizza questo report in base alle tue esigenze
Riceverai la personalizzazione gratuita di qualsiasi report, comprese parti di questo report, o analisi a livello nazionale, pacchetto dati Excel, oltre a usufruire di grandi offerte e sconti per start-up e università
Mercato del software di diagrammazione: approfondimenti strategici
-
Scopri le principali tendenze di mercato in questo rapporto.Questo campione GRATUITO includerà analisi di dati che spaziano dalle tendenze di mercato alle stime e alle previsioni.
Driver e opportunità del mercato del software di diagrammazione
Vantaggi degli strumenti di diagrammazione nel settore aziendale
I diagrammi aiutano a ridurre la complessità della comunicazione. Nell'ambiente aziendale, i diagrammi forniscono una rappresentazione visiva chiara e concisa dei processi aziendali. Aiutano a comprendere tutti i dipendenti in merito agli obiettivi e ai processi che devono essere seguiti nell'implementazione del progetto. Con l'adozione di strumenti di diagrammazione, i team leader o i project manager possono fornire il flusso di lavoro del progetto ai propri dipendenti, spiegandolo con un diagramma. Il software di diagrammazione li aiuta a creare grafici a torta, diagrammi di flusso e molti altri diagrammi modello. La rappresentazione visiva del progetto o degli obiettivi aziendali aiuta i dipendenti a comprendere meglio le tendenze e l'ambito del progetto. Pertanto, le aziende stanno ampiamente adottando software di diagrammazione.
Adozione di software basati su cloud
Grazie all'aumento delle iniziative di industrializzazione e globalizzazione nei paesi sviluppati e in via di sviluppo, le attività commerciali stanno crescendo in tutti i settori. Inoltre, è stato osservato che le aziende stanno adottando la trasformazione digitale per ottenere un vantaggio competitivo e massimizzare la loro produttività. Per questo, l'azienda è alla ricerca di una soluzione conveniente, che sta portando all'adozione della soluzione software di diagrammazione basata su cloud .
Analisi della segmentazione del rapporto di mercato del software di diagrammazione
I segmenti chiave che hanno contribuito alla derivazione dell'analisi di mercato del software di creazione di diagrammi sono il tipo di distribuzione, le dimensioni aziendali e l'applicazione.
- In base al tipo di distribuzione, il mercato del software di diagrammazione è diviso in cloud e on-premise. Il segmento on-premise ha detenuto la quota maggiore del mercato nel 2023.
- In base alle dimensioni aziendali, il mercato è segmentato in piccole e medie imprese e grandi imprese. Si prevede che il segmento delle piccole e medie imprese crescerà con il CAGR più elevato.CAGR.
- In base alle dimensioni aziendali, il mercato è segmentato in istituti scolastici, aziende e personale. Il segmento degli istituti scolastici ha detenuto una quota significativa del mercato nel 2023.corporates, and personnel. The educational institutions segment held a significant share of the market in 2023.
Analisi della quota di mercato del software di diagrammazione per area geografica
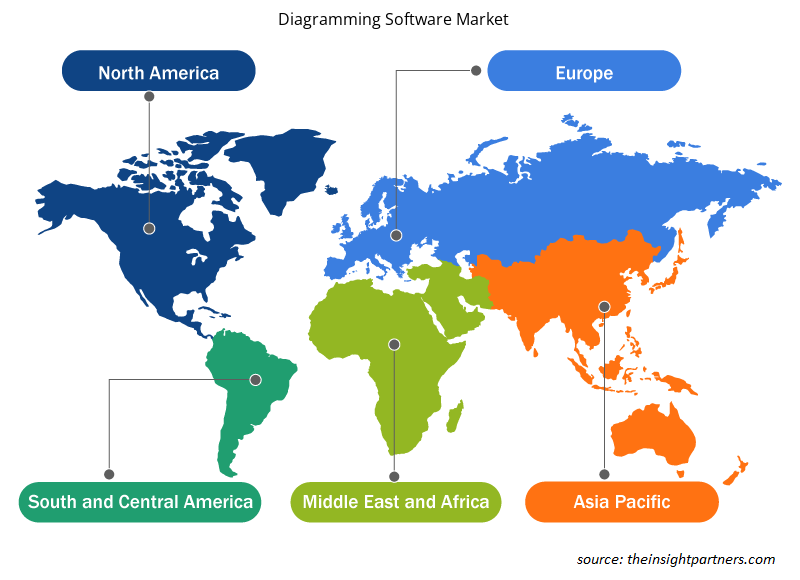
L'ambito geografico del rapporto di mercato sui software di creazione di diagrammi è suddiviso principalmente in cinque regioni: Nord America, Asia Pacifico, Europa, Medio Oriente e Africa, Sud e Centro America.
La regione Asia-Pacifico detiene la quota di mercato più grande e si prevede che crescerà con il CAGR più elevato. Paesi come India, Giappone e Cina detengono la maggior parte della quota di mercato Asia-Pacifico. La crescente digitalizzazione è uno dei principali fattori che portano all'adozione di soluzioni digitali. Le crescenti piattaforme di e-learning e le crescenti PMI nelle nazioni in via di sviluppo stanno guidando l'adozione di soluzioni software di diagrammazione.CAGR. Countries such as India, Japan, and China hold the majority of the Asia-Pacific market share. The growing digitalization is one of the major factors leading to the adoption of digital solutions. Growing e-learning platforms and growing SMEs in developing nations are driving the adoption of diagramming software solutions.
Approfondimenti regionali sul mercato dei software di diagrammi
Le tendenze regionali e i fattori che influenzano il Diagramming Software Market durante il periodo di previsione sono stati ampiamente spiegati dagli analisti di Insight Partners. Questa sezione discute anche i segmenti e la geografia del Diagramming Software Market in Nord America, Europa, Asia Pacifico, Medio Oriente e Africa e Sud e Centro America.
- Ottieni i dati specifici regionali per il mercato del software di diagrammazione
Ambito del rapporto di mercato del software di diagrammi
| Attributo del report | Dettagli |
|---|---|
| Dimensioni del mercato nel 2023 | 837,91 milioni di dollari USA |
| Dimensioni del mercato entro il 2031 | 1786,56 milioni di dollari USA |
| CAGR globale (2023-2031) | 9,9% |
| Dati storici | 2021-2022 |
| Periodo di previsione | 2024-2031 |
| Segmenti coperti |
Per tipo
|
| Regioni e Paesi coperti |
America del Nord
|
| Leader di mercato e profili aziendali chiave |
|
Diagramma della densità dei player del mercato del software: comprendere il suo impatto sulle dinamiche aziendali
Il mercato del software di diagrammazione sta crescendo rapidamente, spinto dalla crescente domanda degli utenti finali dovuta a fattori quali l'evoluzione delle preferenze dei consumatori, i progressi tecnologici e una maggiore consapevolezza dei vantaggi del prodotto. Con l'aumento della domanda, le aziende stanno ampliando le loro offerte, innovando per soddisfare le esigenze dei consumatori e capitalizzando sulle tendenze emergenti, il che alimenta ulteriormente la crescita del mercato.
La densità degli operatori di mercato si riferisce alla distribuzione di aziende o società che operano in un particolare mercato o settore. Indica quanti concorrenti (operatori di mercato) sono presenti in un dato spazio di mercato in relazione alle sue dimensioni o al valore di mercato totale.
Le principali aziende che operano nel mercato dei software per la creazione di diagrammi sono:
- Creativamente
- disegnare.io
- Gliffy di Perforce
- Edrawsoft
- Grafico Lucido
- Microsoft
Disclaimer : le aziende elencate sopra non sono classificate secondo un ordine particolare.
- Ottieni la panoramica dei principali attori del mercato dei software di diagrammazione
Notizie di mercato e sviluppi recenti del software di diagrammazione
Il mercato del software di diagrammazione viene valutato raccogliendo dati qualitativi e quantitativi dopo la ricerca primaria e secondaria, che include importanti pubblicazioni aziendali, dati di associazioni e database. Di seguito sono elencati alcuni degli sviluppi nel mercato del software di diagrammazione:
- Google ha lanciato il nuovissimo Google Cloud Architecture Diagramming Tool. Questo strumento consente all'utente di condividere la visione con il team, collaborare con loro, iterare sulla progettazione e creare la versione finale che meglio soddisfa i requisiti per il caso d'uso aziendale. (Fonte: Google, comunicato stampa, febbraio 2022)
- EdrawMax, un software leader per la creazione di diagrammi, ha lanciato la sua versione mobile, l'app EdrawMax, progettata per consentire agli utenti di creare facilmente diagrammi di flusso e diagrammi a blocchi professionali. Migliorando la produttività e risparmiando tempo agli utenti, la nuova app offre oltre 20.000 modelli di diagrammi di alta qualità che gli utenti possono personalizzare e modificare per creare diagrammi dall'aspetto raffinato. (Fonte: PRNewswire, comunicato stampa, aprile 2023)
Copertura e risultati del rapporto di mercato sul software di diagrammazione
Il rapporto "Dimensioni e previsioni del mercato del software di diagrammi (2021-2031)" fornisce un'analisi dettagliata del mercato che copre le seguenti aree:
- Dimensioni e previsioni del mercato del software di diagrammazione a livello globale, regionale e nazionale per tutti i segmenti di mercato chiave coperti dall'ambito
- Diagramma delle tendenze del mercato del software, nonché dinamiche di mercato quali driver, vincoli e opportunità chiave
- Analisi dettagliata delle cinque forze PEST/Porter e SWOT
- Analisi di mercato del software di diagrammazione che copre le principali tendenze del mercato, il quadro globale e regionale, i principali attori, le normative e i recenti sviluppi del mercato
- Analisi del panorama industriale e della concorrenza che copre la concentrazione del mercato, l'analisi della mappa di calore, i principali attori e gli sviluppi recenti per il mercato del software di creazione di diagrammi
- Profili aziendali dettagliati

Ankita è una dinamica professionista della ricerca di mercato e della consulenza con oltre 8 anni di esperienza nei settori della tecnologia, dei media, dell'ICT, dell'elettronica e dei semiconduttori. Ha guidato e portato a termine con successo oltre 100 incarichi di consulenza e ricerca per clienti globali come Microsoft, Oracle, NEC Corporation, SAP, KPMG ed Expeditors International. Le sue competenze principali includono la valutazione del mercato, l'analisi dei dati, le previsioni, la formulazione di strategie, l'intelligence competitiva e la redazione di report.
Ankita è esperta nella gestione di cicli di progetto completi, dalla progettazione di proposte pre-vendita e discussioni con i clienti fino alla fornitura di insight fruibili post-vendita. È esperta nella gestione di team interfunzionali, nella strutturazione di moduli di ricerca complessi e nell'allineamento delle soluzioni agli obiettivi aziendali specifici del cliente. Le sue eccellenti capacità di comunicazione, leadership e presentazione le hanno permesso di fornire costantemente risultati orientati al valore in contesti di mercato in rapida evoluzione.
- Analisi storica (2 anni), anno base, previsione (7 anni) con CAGR
- Analisi PEST e SWOT
- Valore/volume delle dimensioni del mercato - Globale, Regionale, Nazionale
- Industria e panorama competitivo
- Set di dati Excel
Testimonianze
Il report di mercato sui sistemi SCADA di Insight Partners è completo, con preziosi spunti sulle tendenze attuali e sulle previsioni future. Il team si è dimostrato altamente professionale, reattivo e disponibile in ogni fase del progetto. Siamo molto soddisfatti e consigliamo vivamente i loro servizi.
RAN KEDEM Partner, Reali Technologies LTDsHo richiesto un report su un mercato software molto specifico e il team lo ha prodotto in pochi giorni. Le informazioni erano molto pertinenti e ben presentate. Ho quindi richiesto alcune modifiche e aggiunte al report. Il team è stato ancora una volta molto reattivo e ho ricevuto il report finale in meno di una settimana.
JEAN-HERVE JENN Presidente, Future AnalyticaAbbiamo collaborato con The Insight Partners per un importante studio di mercato e una previsione. Ci hanno fornito informazioni chiare su opportunità e rischi, che ci hanno aiutato a definire i nostri piani. La loro ricerca è stata facile da usare e basata su dati solidi. Ci ha aiutato a prendere decisioni intelligenti e consapevoli. Li consigliamo vivamente.
PIYUSH NAGPAL Vicepresidente senior, Abbaglianti globaliInsight Partners ha fornito ricerche di mercato approfondite e ben strutturate, con una solida competenza nel settore. Il loro team si è dimostrato professionale e reattivo in ogni fase. Il sito web intuitivo ha reso l'accesso ai report di settore semplice e immediato. Li consigliamo vivamente per servizi di ricerca affidabili e di alta qualità.
YUKIHIKO ADACHI Amministratore delegato, Deep Blue, LLC.Questa è la prima volta che acquisto un report di mercato da The Insight Partners. Sebbene inizialmente fossi indeciso, ho visitato il loro sito web e mi sono sentito più a mio agio nell'acquistare un report di mercato. Sono completamente soddisfatto della qualità del report e del servizio clienti. Avevo diverse domande e commenti sul report iniziale, ma dopo un paio di conversazioni via email con il loro analista credo di avere un report che posso utilizzare come input per il nostro processo di pianificazione strategica. Grazie mille per aver dedicato del tempo extra e aver reso questa esperienza positiva. Consiglierò sicuramente il vostro servizio ad altri e sarete la mia prima persona a cui rivolgermi quando avremo bisogno di ulteriori dati di mercato.
GIOVANNI SUZUKI Presidente e Amministratore Delegato, Consigliere di Amministrazione, Tecnologie BKDesidero esprimere la mia gratitudine per il supporto e la professionalità dimostrati nel rispondere alla mia richiesta di informazioni sul mercato dei dispositivi medici in vitro per malattie infettive in Nigeria. Apprezzo la vostra pazienza, la vostra guida e la vostra disponibilità a offrirmi uno sconto, che alla fine ci ha permesso di concludere l'affare. Non vedo l'ora di collaborare con The Insight Partners in futuro, grazie anche all'impressione che mi avete lasciato dopo questo primo incontro.
Dott. Chijioke AMMINISTRATORE DELEGATO DI ONYIA, PineCrest Healthcare Ltd.Motivo dell'acquisto
- Processo decisionale informato
- Comprensione delle dinamiche di mercato
- Analisi competitiva
- Analisi dei clienti
- Previsioni di mercato
- Mitigazione del rischio
- Pianificazione strategica
- Giustificazione degli investimenti
- Identificazione dei mercati emergenti
- Miglioramento delle strategie di marketing
- Aumento dell'efficienza operativa
- Allineamento alle tendenze normative


Sblocca sconti esclusivi sui report
Richiedi ora


 Ottieni un campione gratuito per - Mercato del software di diagrammi