
Diagramming Software Market Drivers and Forecasts by 2031
Coverage: By Deployment Type (Cloud and On-Premises), Enterprise Size (Small and Medium-Size Enterprises and Large Enterprises), Application (Educational Institutions, Corporations, and Personal), and Geography
- Status : Data Released
- Report Code : TIPRE00011177
- Category : Technology, Media and Telecommunications
- No. of Pages : 150
- Available Report Formats :


- Last update date : August 26, 2024

2023 Market Size
US$ 837.91 Mn
Base year value
2031 Forecast
US$ 1786.56 Mn
Projected by 2031
CAGR 2024-2031
9.9 %
Growth rate
Addressable Market
US$ 10,492.71 Mn
(2024-2031)
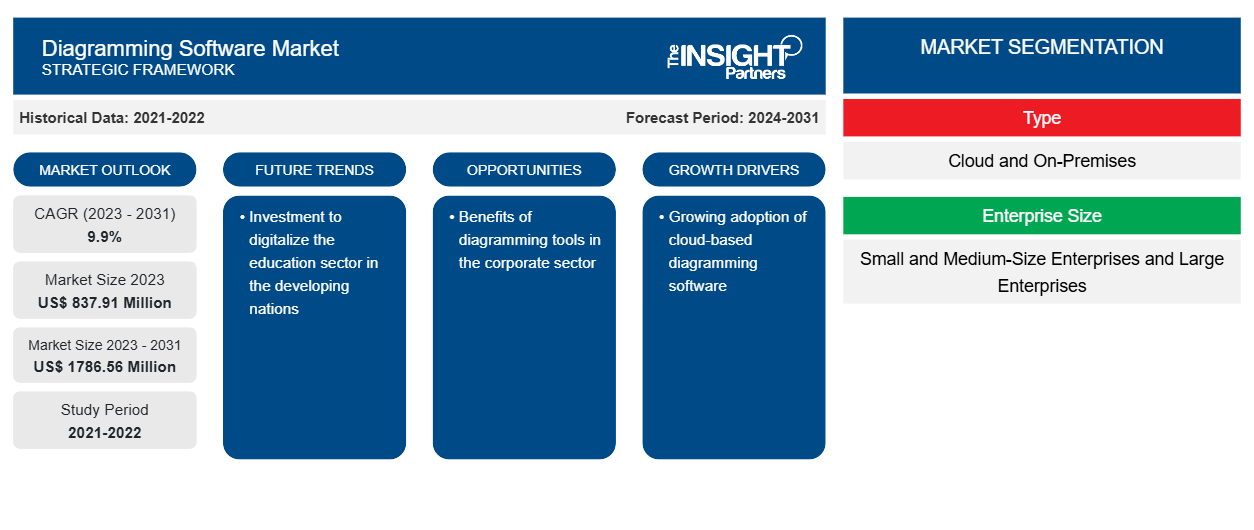
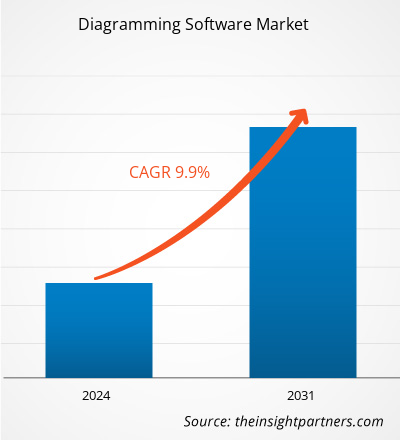
The diagramming software market size is projected to reach US$ 1786.56 million by 2031 from US$ 837.91 million in 2023. The market is expected to register a CAGR of 9.9% during 2023–2031. The rise in digitalization and growing adoption of cloud-based diagramming software are likely to remain key trends in the market.
Diagramming Software Market Analysis
The diagramming software market is gaining traction due to the rising adoption of large enterprises and small and medium-sized enterprises. The adoption of this software helps them to better define the workflow and operation in the business environment. Various departments of the organization such as marketing, HR, engineering, and operations, can widely use it.
Diagramming Software Market Overview
With the help of diagramming software, the user can create detailed diagrams, which include flow charts, pie charts, floor plans, and other diagrams, based on the datasets and images. Diagramming software includes various templates which help the user to create the diagram from scratch. This software can easily integrate with other tools and platforms where multiple users can view and contribute to creating the diagram.
Market Assessment and Insights
- Global market for Diagramming Software was valued at US$ 837.91 Million in 2023
- Annual market size is expected to reach US$ 1,786.56 Million by 2031
- Total addressable market (TAM) during 2024-2031 is projected to reach approximately US$ 10,492.71 Million
- Market is anticipated to register a CAGR of 9.9% during the forecast period
- The United States represents a key market, supported by Growing adoption of cloud-based diagramming software, as well as evolving industry dynamics
- Market analysis covers North America, Europe, Asia-Pacific, South and Central America, Middle East and Africa, with growth evaluated across the forecast period
- Market opportunities such as Benefits of diagramming tools in the corporate sector are expected to influence market dynamics and addressable market
- Report profiles industry participants, including Creately, draw.io, Gliffy by Perforce, Edrawsoft, Lucidchart, Microsoft, FigJam, MyDraw, NULAB, SmartDraw, while analyzing competitive strategies and innovation developments
-
Source: The Insight Partners' analysis based on proprietary research, government publications, company annual reports, investor presentations, industry databases, and expert interviews.
● REPORT CUSTOMIZATION
Tailor This Report To Align With Your Specific Business Requirements
This report can be customized to align precisely with your business objectives, scope, and target markets. Customization options include tailored segmentation, geography, competitive analysis, and strategic insights to support informed decision-making.
Customize This Report →WHAT YOU CAN ADJUST
- ● Segmentations
- ● Geography
- ● Competitive Analysis
- ● Language Preferences
Diagramming Software Market: Strategic Insights
-
Get Top Key Market Trends of this report.This FREE sample will include data analysis, ranging from market trends to estimates and forecasts.
Diagramming Software Market Drivers and Opportunities
Benefits of diagramming tools in the corporate sector
Diagrams help reduce the communication complexity. In the business environment, diagrams provide a clear and concise visual representation of business processes. It helps to understand all the employees regarding the goals and processes that need to be followed in the project implementation. With the adoption of diagramming tools, the team leads, or project managers can deliver the project workflow to their employees, explaining with a diagram. Diagramming software helps them to create pie charts, flow charts, and several other templatized diagrams. The visual representation of the project or business goals helps the employees to better understand the trends and scope of the project. Hence, corporates are widely adopting diagramming software.
Adoption of cloud-based software
Owing to the rise in industrialization and globalization initiatives in both developed and developing countries, business activities are growing across all industries. Additionally, it has been observed that businesses are adopting digital transformation to gain a competitive advantage and maximize their productivity. For this, the business is looking for a cost-effective solution, which is leading to the adoption of the cloud-based diagramming software solution.
Diagramming Software Market Report Segmentation Analysis
Key segments that contributed to the derivation of the diagramming software market analysis are the deployment type, enterprise size, and application.
- Based on the deployment type, the diagramming software market is divided into cloud and on-premise. The on-premise segment held the largest share of the market in 2023.
- By enterprise size, the market is segmented into small and medium-sized enterprises and large enterprises. The small and medium-sized enterprises segment is expected to grow with the highest CAGR.
- By enterprise size, the market is segmented into educational institutions, corporates, and personnel. The educational institutions segment held a significant share of the market in 2023.
Diagramming Software Market Share Analysis by Geography
The geographic scope of the diagramming software market report is mainly divided into five regions: North America, Asia Pacific, Europe, Middle East & Africa, and South & Central America.
Asia Pacific region held the largest market share and is expected to grow with the highest CAGR. Countries such as India, Japan, and China hold the majority of the Asia-Pacific market share. The growing digitalization is one of the major factors leading to the adoption of digital solutions. Growing e-learning platforms and growing SMEs in developing nations are driving the adoption of diagramming software solutions.
Diagramming Software Market Report Scope
| Report Attribute | Details |
|---|---|
| Market size in 2023 | US$ 837.91 Million |
| Market Size by 2031 | US$ 1786.56 Million |
| Global CAGR (2023 - 2031) | 9.9% |
| Historical Data | 2021-2022 |
| Forecast period | 2024-2031 |
| Segments Covered |
By Type
|
| Regions and Countries Covered |
North America
|
| Market leaders and key company profiles |
|
Diagramming Software Market Players Density: Understanding Its Impact on Business Dynamics
The Diagramming Software Market is growing rapidly, driven by increasing end-user demand due to factors such as evolving consumer preferences, technological advancements, and greater awareness of the product's benefits. As demand rises, businesses are expanding their offerings, innovating to meet consumer needs, and capitalizing on emerging trends, which further fuels market growth.
Diagramming Software Market News and Recent Developments
The diagramming software market is evaluated by gathering qualitative and quantitative data post primary and secondary research, which includes important corporate publications, association data, and databases. A few of the developments in the diagramming software market are listed below:
- Google launched the brand-new Google Cloud Architecture Diagramming Tool. This tool enables the user to share the vision with the team, collaborate with them, iterate on the design, and create the final version that best meets the requirements for the business use case. (Source: Google, Press Release, February 2022)
- EdrawMax, a leading diagramming software, rolled out its mobile version, the EdrawMax App, which is designed to enable users to create professional flowcharts and block diagrams with ease. Improving productivity and saving time for users, the new app offers over 20,000 high-quality diagram templates that users can customize and modify to create polished-looking diagrams. (Source: PRNewswire, Press Release, April 2023)
Diagramming Software Market Report Coverage and Deliverables
The "Diagramming Software Market Size and Forecast (2021–2031)" report provides a detailed analysis of the market covering below areas:
- Diagramming software market size and forecast at global, regional, and country levels for all the key market segments covered under the scope
- Diagramming software market trends, as well as market dynamics such as drivers, restraints, and key opportunities
- Detailed PEST/Porter's Five Forces and SWOT analysis
- Diagramming software market analysis covering key market trends, global and regional framework, major players, regulations, and recent market developments
- Industry landscape and competition analysis covering market concentration, heat map analysis, prominent players, and recent developments for the diagramming software market
- Detailed company profiles
Frequently Asked Questions

- Comprehensive Market Sizing and Forecast Analysis
- Detailed Segmentation Analysis
- In-Depth Market Dynamics Assessment
- Regional and Country-Level Insights
- Competitive Landscape and Company Benchmarking
- Strategic Business Intelligence
Recent Reports
Testimonials
The Insight Partners' SCADA System Market report is comprehensive, with valuable insights on current trends and future forecasts. The team was highly professional, responsive, and supportive throughout. We are very satisfied and highly recommend their services.
RAN KEDEM Partner, Reali Technologies LTDsI requested a report on a very specific software market and the team produced the report in a few days. The information was very relevant and well presented. I then requested some changes and additions to the report. The team was again very responsive and I got the final report in less than a week.
JEAN-HERVE JENN Chairman, Future AnalyticaWe worked with The Insight Partners for an important market study and forecast. They gave us clear insights into opportunities and risks, which helped shape our plans. Their research was easy to use and based on solid data. It helped us make smart, confident decisions. We highly recommend them.
PIYUSH NAGPAL Sr. Vice President, High Beam GlobalThe Insight Partners delivered insightful, well-structured market research with strong domain expertise. Their team was professional and responsive throughout. The user-friendly website made accessing industry reports seamless. We highly recommend them for reliable, high-quality research services
YUKIHIKO ADACHI CEO, Deep Blue, LLC.This is the first time I have purchased a market report from The Insight Partners.While I was unsure at first, I visited their web site and felt more comfortable to take the risk and purchase a market report.I am completely satisfied with the quality of the report and customer service. I had several questions and comments with the initial report, but after a couple of dialogs over email with their analyst I believe I have a report that I can use as input to our strategic planning process.Thank you so much for taking the extra time and making this a positive experience.I will definitely recommend your service to others and you will be my first call when we need further market data.
JOHN SUZUKI President and Chief Executive Officer, Board Director, BK TechnologiesI wish to appreciate your support and the professionalism you displayed in the course of attending to my request for information regarding to infectious disease IVD market in Nigeria. I appreciate your patience, your guidance, and the fact that you were willing to offer a discount, which eventually made it possible for us to close a deal. I look forward to engaging The Insight Partners in the future, all thanks to the impression you have created in me as a result of this first encounter.
DR CHIJIOKE ONYIA MANAGING DIRECTOR, PineCrest Healthcare Ltd.Reason to Buy
- Informed Decision-Making
- Understanding Market Dynamics
- Competitive Analysis
- Identifying Emerging Markets
- Customer Insights
- Market Forecasts
- Risk Mitigation
- Boosting Operational Efficiency
- Strategic Planning
- Investment Justification
- Tracking Industry Innovations
- Aligning with Regulatory Trends


