
Air Quality Monitoring Market Size, Share & Trends by 2034
Coverage: By Component (Hardware, Software and Services); Product Type (Outdoor and Indoor); Deployment Type (Fixed Monitoring Systems and Portable Monitoring Systems); Sampling Method (Active Monitoring Systems, Passive Monitoring, Manual Monitoring, and Others); End User Industry (Government and Regulatory Bodies, Industrial and Manufacturing Sector, Commercial and Institutional Buildings, Residential Users, and Environmental Research and Academia) and Geography (North America, Europe, Asia Pacific, Middle East and Africa, and South and Central America)
- Status : Published
- Report Code : TIPTE100000492
- Category : Electronics and Semiconductor
- No. of Pages : 306
- Available Report Formats :


- Last update date : August 14, 2026


2025 Market Size
US$ 7.23 Bn
Base year value
2034 Forecast
US$ 14.37 Bn
Projected by 2034
CAGR 2026-2034
7.9 %
Growth rate
Addressable Market
US$ 97.01 Bn
(2026-2034)
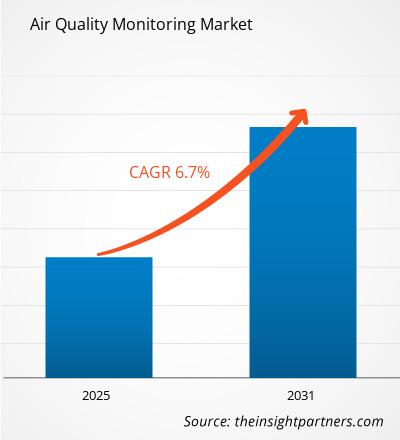
Air Quality Monitoring Market was valued at US$ 7.23 Billion in 2025 and is projected to reach US$ 14.37 Billion by 2034, expanding at a CAGR of 7.9% during 2026–2034. The market reflects growing investment in pollutant detection, continuous emissions tracking, indoor exposure management, and public health surveillance as governments, industries, and building owners prioritize reliable data for compliance and risk reduction.
North America remains a high-value demand center, with an estimated 8.4% CAGR supported by EPA monitoring modernization, wildfire smoke exposure, and building-level air safety programs. Air Quality Monitoring Market size in the region is reinforced by dense industrial permitting activity, ambient sensor upgrades, and stronger procurement for portable systems used by utilities, schools, laboratories, and emergency response agencies.
Air Quality Monitoring Market Assessment and Insights
- North America held 27.6% share in 2025 and is growing at a CAGR of 8.4% between 2026–2034, supported by regulatory monitoring, wildfire response, and industrial compliance.
- US represented 60.4% of North America in 2025 and is growing at a CAGR of 9.1% between 2026–2034, driven by EPA networks and industrial permitting.
- Europe accounted for 42.4% share in 2025 and is growing at a CAGR of 7.3 % between 2026–2034, led by Germany, the UK, France, Italy, and Spain.
- Asia Pacific captured 21.0% share in 2025 and is growing at a CAGR of 9.2% between 2026–2034, with China, India, Japan, South Korea, and Australia leading deployment.
- Largest Segment Hardware held 69.9% market share in 2025 and is growing at a CAGR of 8.3 % between 2026–2034.
- High Growth Segment Industrial and Manufacturing Sector held 27.6% market share in 2025 and is growing at a CAGR of 9.2% between 2026–2034.
- Key companies analyzed in detail: Agilent Technologies, Inc.; Emerson Electric Co.; Thermo Fisher Scientific Inc.; Siemens AG; Teledyne Technologies Incorporated; Honeywell International Inc.; HORIBA, Ltd.; 3M Company; Testo SE & Co. KGaA; and Aeroqual Limited.
Source: The Insight Partners' analysis based on proprietary research, government publications, company annual reports, investor presentations, industry databases, and expert interviews.
Migration of technology is changing monitoring architectures through the combination of reference stations with portable analyzers, optical particle counters, electrochemical sensors, and cloud calibration. The production environment favors modularity in hardware and software, which allows for data validation, visualization, and auditing. All this facilitates growth in the Air Quality Monitoring Market because there is a growing need for justifiable measurements in ambient air, industrial settings, construction boundaries, laboratory environments, and interiors.
Future growth will depend on national clean air regulations, investments in smart cities, stronger regulation of occupational exposure limits, and increasing consumer awareness following episodes of smoke and high temperatures. New geographies will build more continuous monitoring solutions, whereas existing geographies will update old stations and deploy hyperlocal networks. Procurement will remain favorable with regard to PM2.5, nitrogen dioxide, ozone, VOCs, and source emissions.
Air Quality Monitoring Market Report Scope
| Report Attribute | Details |
|---|---|
| Market size in 2025 | US$ 7.23 Billion |
| Market Size by 2034 | US$ 14.37 Billion |
| Global CAGR (2026 - 2034) | 7.9% |
| Historical Data | 2021-2024 |
| Forecast period | 2026-2034 |
Air Quality Monitoring Market Analysis
Demand is increasing due to the fact that air pollution is still seen as an issue of compliance and risk of health impacts. According to WHO statistics, 99% of the world's population is subjected to pollution at levels exceeding the guideline values, and the WHO ambient database of 2024 contains measurements of 7,182 locations. This supports the importance of having monitoring devices that help turn issues related to exposure into policy, enforcement, workplace safety, and community alerts.
Value chain encompasses sensor materials, pumps, analyzers, calibration gases, connectivity devices, software platforms, system integration services, and maintenance. Current trends in supply are geared towards lifetime contracts as users require not only calibration but also reliability and data validity. The Air Quality Monitoring Market analysis shows that differentiation in hardware alone is not enough without analytics and measurement performance..
Competitive positioning involves diversification of industrial technology group and specialists in instrument manufacturer. Thermo Fisher Scientific Inc., Teledyne Technologies Incorporated, HORIBA, Ltd. and Agilent Technologies, Inc. rely on their analytical precision to be competitive, whereas Emerson Electric Co., Siemens AG and Honeywell International Inc. leverage automation, construction and process control associations. 3M Company, Testo SE & Co. KGaA and Aeroqual Limited develop occupational and portable monitoring markets.
Investments are flowing to low maintenance particulate sensors, multipollutant nodes, methane and VOC sensors, wireless communication and data validation using artificial intelligence. Consumers are increasingly comparing cost of ownership, availability of service and data defensibility rather than price alone. Manufacturers with certified analyzers, scalable software and regional service capabilities have an advantage for regulators, utilities, manufacturers, contractors and commercial property operators.
● REPORT CUSTOMIZATION
Tailor This Report To Align With Your Specific Business Requirements
This report can be customized to align precisely with your business objectives, scope, and target markets. Customization options include tailored segmentation, geography, competitive analysis, and strategic insights to support informed decision-making.
Customize This Report →WHAT YOU CAN ADJUST
- ● Segmentations
- ● Geography
- ● Competitive Analysis
- ● Language Preferences
Air Quality Monitoring Market: Strategic Insights
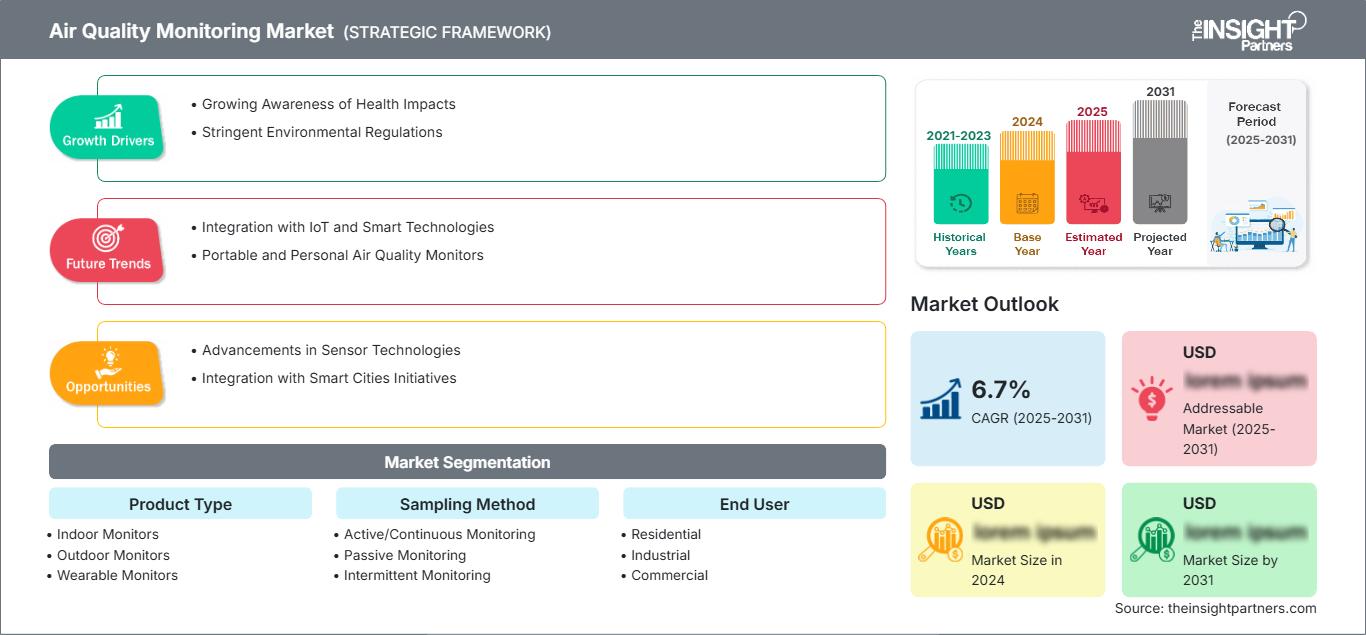
Regional Insights
North America Air Quality Monitoring Market
North America held 27.5% share in 2025 and is expected to grow at a CAGR of 8.4% during 2026–2034. Air Quality Monitoring Market share is supported by federal and state compliance programs, public wildfire smoke mapping, industrial permitting, and continuous emissions oversight across power, oil and gas, chemicals, and transport corridors.
The EPA’s AirData program offers air monitor data in the United States, Puerto Rico, and U.S. Virgin Islands, whereas AirNow gives AQI public data. The highest demand exists for stationary outdoor monitors, portable monitors for emergencies, and indoor monitors for schools, health care, and offices. Traceability, reliability, and system integration are most valued by regional purchasers.
U.S. Air Quality Monitoring Market
The US accounted for 60.4% of North America in 2025 and is projected to grow at a CAGR of 9.1% from 2026–2034. Regulatory reporting, wildfire exposure, petrochemical fenceline monitoring, and warehouse indoor air programs support broad procurement. EPA monitor maps covering criteria pollutants reinforce demand for defensible data from certified and near-reference instruments.
Thermo Fisher Scientific Inc., Teledyne Technologies Incorporated, Honeywell International Inc., Emerson Electric Co., 3M Company, and Aeroqual Limited maintain strong application visibility across ambient, industrial hygiene, and remediation projects. Buyers are adopting portable monitors for incident response, fixed systems for compliance, and software dashboards that combine pollutants, meteorology, alarms, and historical reporting.
Europe Air Quality Monitoring Market
Europe represented 42.4% share in 2025 and is forecast to grow at a CAGR of 7.3% through 2034. Germany leads due to industrial monitoring, automotive emissions expertise, and instrument manufacturing depth. The UK is advancing local authority networks, school exposure studies, and construction perimeter programs as urban air policy remains politically visible.
France, Italy, and Spain add demand through city-level low-emission planning, transport corridors, and industrial source monitoring. The European Environment Agency reported that 94% of the EU urban population remains exposed to PM2.5 above WHO guideline levels, sustaining investment in station modernization. Siemens AG, Testo SE & Co. KGaA, and HORIBA, Ltd. support regional supply strength.
APAC Air Quality Monitoring Market
APAC held 21.0% share in 2025 and is expected to grow at a CAGR of 9.2% during 2026–2034. China leads through industrial monitoring scale, urban air programs, and manufacturing capacity, while Japan and South Korea add demand for precision instruments, indoor monitoring, and factory compliance.
India and Australia enhance regional momentum via national clean air initiatives, mine emissions regulation, ports, construction, and public health monitoring. Thermo Fisher Scientific Inc. started producing AQMS analyzers in India from 2024, an indication of localization pressure. Regional customers require robust analyzers, rapid service, and scalable networks which are capable of dealing with dusty operating conditions.
Middle East & Africa Air Quality Monitoring Market
Middle East & Africa is projected to grow at a CAGR of 6.1% during 2026–2034. Saudi Arabia leads regional demand as energy projects, industrial cities, and smart infrastructure programs require ambient, source, and worker exposure monitoring. UAE adoption is supported by urban development, airports, logistics zones, and indoor air quality programs.
Demand is generated from South Africa and the rest of the MEA from mining, power production, petrochemicals, and environmental permitting. Rough weather, high temperatures, and difficult to reach locations will favor portable and robust equipment. There is a growing need by government and facility operators for continuous monitoring data.
Segmentation Analysis
Component
The Air Quality Monitoring Market scope across components is widening as buyers combine analyzers, sensors, pumps, calibration tools, software, and services into integrated monitoring programs. Hardware remains the anchor, while software and services increase recurring revenue through data validation, maintenance, dashboards, and compliance reporting.
- Hardware remains the largest component category because certified analyzers, particulate samplers, gas detectors, meteorological sensors, and calibration accessories are essential for defensible ambient and industrial measurements.
- Software and Services are gaining strategic importance as users need remote dashboards, QA/QC workflows, audit trails, predictive maintenance, and expert support to sustain reliable monitoring networks.
Product Type
Outdoor systems lead compliance-led procurement because ambient networks, industrial sites, ports, and construction corridors require continuous public or regulatory visibility. Indoor systems are scaling faster as building owners, schools, hospitals, and workplaces evaluate ventilation, particulate matter, carbon dioxide, VOCs, and occupant exposure risks.
- Outdoor products dominate public and industrial monitoring networks where weatherproof enclosures, certified analyzers, telemetry, and continuous measurements support enforcement, forecasting, and community transparency.
- Indoor products are expanding through commercial offices, schools, healthcare facilities, laboratories, and residences where ventilation performance and exposure management increasingly influence procurement decisions.
Deployment Type
Fixed monitoring systems are preferred where long-term regulatory continuity, trend analysis, and automated reporting are required. Portable monitoring systems are gaining momentum for incident response, site remediation, construction projects, occupational checks, and temporary community exposure studies that require faster deployment.
- Fixed Monitoring Systems provide long-duration data continuity, audited measurements, and automated reporting for government networks, industrial stacks, fencelines, and urban ambient stations.
- Portable Monitoring Systems support flexible deployment for emergency response, construction dust control, worker safety, remediation projects, and short-term studies where location-specific exposure can change quickly.
Sampling Method
Active systems remain essential for continuous and high-confidence measurements, while passive and manual approaches support screening, audits, and lower-cost deployment. Buyers often blend methods to balance regulatory defensibility, spatial coverage, operational cost, and pollutant-specific measurement requirements.
- Active Monitoring Systems use pumps, analyzers, and continuous sensors to generate real-time data for ambient networks, industrial compliance, emergency response, and high-priority exposure management.
- Passive Monitoring offers lower-cost spatial coverage for screening pollutants over time, supporting urban studies, workplace assessments, and source identification before higher-cost instruments are deployed.
- Manual Monitoring remains important for gravimetric sampling, laboratory confirmation, audit validation, and regulatory programs that require documented filter handling and controlled analytical procedures.
End User Industry
Government and regulatory bodies anchor baseline demand, while industrial users, commercial buildings, residential consumers, and research organizations broaden the addressable base. Procurement is increasingly linked to compliance evidence, ESG reporting, occupant health, public transparency, and localized exposure analytics.
- Government and Regulatory Bodies lead procurement through ambient networks, emission inventories, public AQI communication, enforcement programs, and clean air plans that require credible long-term data.
- Industrial and Manufacturing Sector uses monitoring for stack emissions, fenceline exposure, worker safety, permitting, leak detection, and operational controls across power, chemicals, metals, mining, and oil and gas.
- Commercial and Institutional Buildings are adopting indoor systems to manage ventilation, occupancy comfort, infection-risk concerns, energy efficiency, and tenant expectations for measurable air safety.
- Residential Users represent a scaling consumer channel as wildfire smoke, urban pollution, cooking emissions, and smart-home integration increase interest in compact indoor monitors.
- Environmental Research and Academia require high-quality instruments and dense sensor networks for exposure studies, source apportionment, climate-health research, and validation of low-cost monitoring technologies.
Opportunity Snapshot
| End User Industry | Revenue Contribution | Trend Tag | Adoption Stage |
| Government and Regulatory Bodies | High | Public AQI | Mature |
| Industrial and Manufacturing Sector | High | Fenceline Data | Scaling |
| Commercial and Institutional Buildings | Medium | Healthy Buildings | Scaling |
| Residential Users | Low | Smart Homes | Emerging |
| Environmental Research and Academia | Medium | Exposure Science | Mature |
Air Quality Monitoring Market Growth Drivers and Impact Analysis
Stricter air standards and public disclosure requirements
The connection between measured air quality and action enforcement has become more stringent. The revision of standards, cities’ plans to reduce pollution, industrial permits, and AQI public reporting require accurate measuring tools that can pass audit review. The data of WHO about exposure and that of EEA about reporting indicates that guideline deficiencies are significant despite reductions in pollution levels; hence, investments will continue in the measurement of PM2.5, PM10, ozone, nitrogen dioxide, sulfur dioxide, carbon monoxide, and VOC. The effect of this change on the market is the increased demand for calibrated instruments and software.
Industrial compliance and worker exposure monitoring
Industries are using air monitors to mitigate their regulatory and operational risk exposure. Power generation, refining, mining, chemical, cement, metal, and waste management industries require the use of source, fence line, and work place monitors to detect emissions, control emissions, and protect the health of their workers. Portable monitors also assist safety professionals to react to any leak detection, confined space danger, dust events, and shutdowns. Effectively, this results in increased budget allocation towards multi-gas, dust monitors, fixed monitors, and alarm systems.
Indoor air quality becomes a measurable building metric
Property owners have transitioned from comfort ventilation principles to exposure-based ventilation practices. Educational institutions, healthcare facilities, office buildings, laboratories, airports, and residential consumers measure particulates, CO2, VOCs, temperature, humidity, and ventilation efficiency to make operation decisions. As energy efficiency becomes important, the requirement of balancing fresh air with good air quality arises as an added driver. The added driver broadens the scope of demand from environmental agencies to facilities management, HVAC integration, and smart buildings, generating continuous revenue streams for sensors, dashboards, calibration, and service agreements.
Air Quality Monitoring Market Future Trends
Hybrid reference and sensor networks
Trends in Air Quality Monitoring Market are going to be defined by hybrid network solutions featuring certified reference stations complemented with dense arrays of either cheap or near-reference sensors. With such an approach, the users would be able to preserve audit-grade anchor points and increase spatial resolution around schools, roads, ports, industrial areas, and wildfire-susceptible locations. Calibration, drift adjustment, meteorological normalization, and confidence scores will be the features of the future air quality monitoring systems. Companies that could demonstrate the quality of measurements for hybrid networks would have competitive advantages.
Analytics-driven exposure intelligence
The monitoring value will move away from the ownership of instrumentation toward the insight provided by the analytics that generate exposure intelligence. The platforms will integrate readings for pollution levels, weather, sources active, occupancy, and ventilation along with patterns of exceedances to suggest actions. Industrial users will have the choice of automating the alerting for fence-line events, whereas building managers will be able to adapt their ventilation needs based on current conditions. Researchers will utilize the combined datasets for source apportionment and health research.
Air Quality Monitoring Market Opportunities
Localized manufacturing and service for emerging networks
There is a need for monitoring technologies tailored to local emission profiles, maintenance skills, and budget limitations in emerging markets. Local assembly, calibration laboratories, spare parts, and technicians' training would help minimize maintenance periods and increase confidence in the reliability of measurements. The case of India’s localization of AQMS analyzers manufacture demonstrates how national air quality improvement initiatives may impact the supply chain. Firms which collaborate with regulatory bodies, municipalities, and industry clusters are able to ensure stable service contracts and adaptation of products to local climatic conditions.
Indoor monitoring integration with smart buildings
Commercial buildings present an incremental opportunity with air quality data becoming a component of tenant satisfaction, energy management, and workplace health and safety requirements. Suppliers have the option of combining particulate, CO2, VOC, temperature, and humidity data from sensors to drive ventilation and filtration. The best business model involves integrating sensors, analysis, reporting, and maintenance in subscription-based services. Integrators for heating, ventilating, and air-conditioning (HVAC), and instruments suppliers are presented with the opportunity of turning occasional indoor air tests into monitoring programs.
Recent Developments
- March 2026: Siemens announced its participation in the groundbreaking Advanced Research Projects Agency for Health (ARPA-H) BREATHE program, an up to five-year initiative aimed at improving indoor air quality and reducing respiratory disease incidence by at least 25%. This effort underscores Siemens’ commitment to leveraging technology for healthier, more resilient environments. The BREATHE program intends to advance the next generation of smart and healthy buildings by developing integrated systems that will provide continual measurement and risk assessment of indoor air quality and deploy real-time interventions, like extra ventilation or disinfection, to reduce airborne threats to human health
- September 2026: HORIBA Group’s Air Quality Monitor AP-380 Series has received type approvals from certification bodies including the U.S. Environmental Protection Agency (U.S. EPA), the German Federal Environment Agency (UBA) jointly with TÜV Rheinland Energy GmbH (TÜV), CSA Group Testing UK Ltd (CSA Group) on behalf of the UK Environment Agency (EA), South Korea’s National Institute of Environmental Research (NIER), and the State Administration for Market Regulation of the People’s Republic of China (SAMR). These approvals enable the analyzers to be sold to national and local governments, and other organizations, primarily focused on Europe, the Americas, the Middle East, East Asia, and Southeast Asia.
- March 2026: 3M announced that it has entered into a definitive agreement to acquire Madison Fire & Rescue, in partnership with Bain Capital. 3M and Bain Capital will establish a new joint venture in which 3M will contribute Scott Safety, receive $700M of cash proceeds upon closing and own 50.1% of the new company, with Bain Capital owning 49.9%. 3M's deep expertise and track record in the safety industry, combined with Bain Capital's capability to integrate businesses, accelerate growth and drive synergies, make this an ideal partnership.
Frequently Asked Questions

- Comprehensive Market Sizing and Forecast Analysis
- Detailed Segmentation Analysis
- In-Depth Market Dynamics Assessment
- Regional and Country-Level Insights
- Competitive Landscape and Company Benchmarking
- Strategic Business Intelligence
Recent Reports
Testimonials

The Insight Partners' SCADA System Market report is comprehensive, with valuable insights on current trends and future forecasts. The team was highly professional, responsive, and supportive throughout. We are very satisfied and highly recommend their services.
RAN KEDEM Partner, Reali Technologies LTDs
I requested a report on a very specific software market and the team produced the report in a few days. The information was very relevant and well presented. I then requested some changes and additions to the report. The team was again very responsive and I got the final report in less than a week.
JEAN-HERVE JENN Chairman, Future Analytica
We worked with The Insight Partners for an important market study and forecast. They gave us clear insights into opportunities and risks, which helped shape our plans. Their research was easy to use and based on solid data. It helped us make smart, confident decisions. We highly recommend them.
PIYUSH NAGPAL Sr. Vice President, High Beam Global
The Insight Partners delivered insightful, well-structured market research with strong domain expertise. Their team was professional and responsive throughout. The user-friendly website made accessing industry reports seamless. We highly recommend them for reliable, high-quality research services
YUKIHIKO ADACHI CEO, Deep Blue, LLC.
This is the first time I have purchased a market report from The Insight Partners.While I was unsure at first, I visited their web site and felt more comfortable to take the risk and purchase a market report.I am completely satisfied with the quality of the report and customer service. I had several questions and comments with the initial report, but after a couple of dialogs over email with their analyst I believe I have a report that I can use as input to our strategic planning process.Thank you so much for taking the extra time and making this a positive experience.I will definitely recommend your service to others and you will be my first call when we need further market data.
JOHN SUZUKI President and Chief Executive Officer, Board Director, BK Technologies
I wish to appreciate your support and the professionalism you displayed in the course of attending to my request for information regarding to infectious disease IVD market in Nigeria. I appreciate your patience, your guidance, and the fact that you were willing to offer a discount, which eventually made it possible for us to close a deal. I look forward to engaging The Insight Partners in the future, all thanks to the impression you have created in me as a result of this first encounter.
DR CHIJIOKE ONYIA MANAGING DIRECTOR, PineCrest Healthcare Ltd.Reason to Buy
- Informed Decision-Making
- Understanding Market Dynamics
- Competitive Analysis
- Identifying Emerging Markets
- Customer Insights
- Market Forecasts
- Risk Mitigation
- Boosting Operational Efficiency
- Strategic Planning
- Investment Justification
- Tracking Industry Innovations
- Aligning with Regulatory Trends





 Get Free Sample for