
Returns Management Software Market Share and Forecast by 2031
Coverage: By Component (Solution and Services), Deployment (Cloud and On Premises), and Enterprise Size (Large Enterprises and SMEs), and Geography
- Status : Published
- Report Code : TIPRE00028927
- Category : Technology, Media and Telecommunications
- No. of Pages : 162
- Available Report Formats :


- Last update date : June 13, 2024

2023 Market Size
US$ 1.58 Bn
Base year value
2031 Forecast
US$ 3.29 Bn
Projected by 2031
CAGR 2024-2031
9.6 %
Growth rate
Addressable Market
US$ 19.52 Bn
(2024-2031)
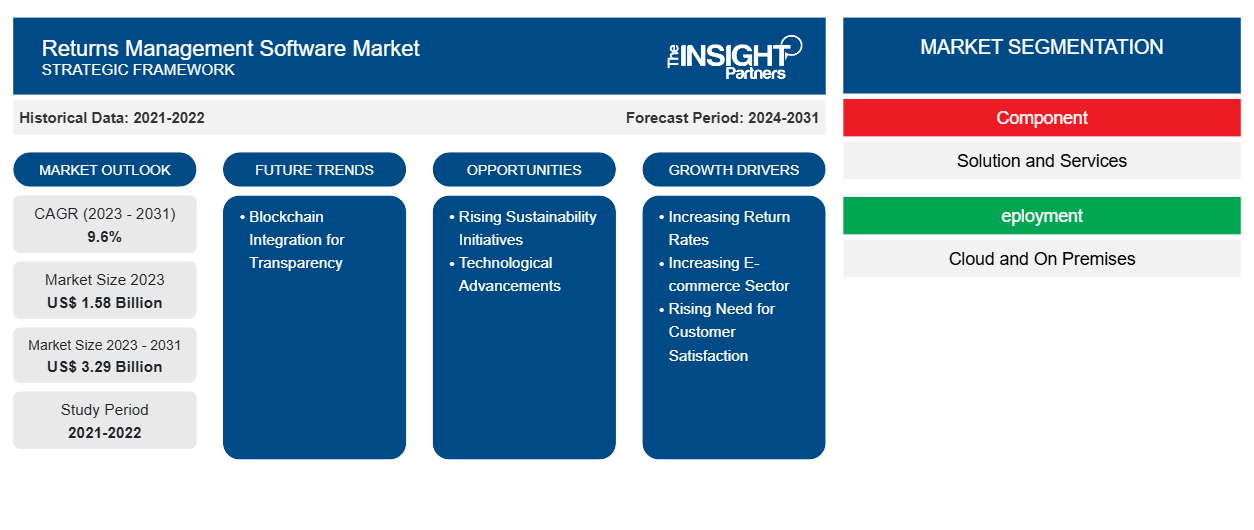
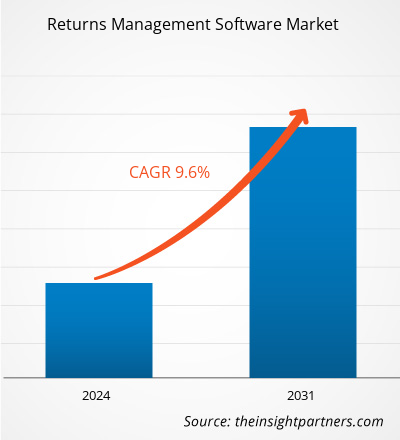
The returns management software market valued US$ 1.58 billion in 2023 and is expected to reach US$ 3.29 billion by 2031; it is estimated to record a CAGR of 9.6% from 2023 to 2031. The report includes growth prospects in light of current returns management software market trends and driving factors influencing the market growth.
Returns Management Software Market Analysis
In today's competitive market, customers expect a seamless and hassle-free return experience. Returns management software helps businesses meet these expectations by providing efficient and transparent return processes, enhancing customer satisfaction, and building brand loyalty. Furthermore, returns can be costly for businesses due to shipping, labor, and inventory write-offs. Returns management software helps optimize the return process, reducing costs associated with returns by automating workflows, improving inventory management, and minimizing errors. All such factors contribute to the market growth.
Increasing return rates, a growing e-commerce sector, and a rising need for customer satisfaction are a few of the factors propelling the market growth. Rising sustainability initiatives and technological advancements will also create significant opportunities for the market. Blockchain integration for transparency would bring new market trends in the coming years.
Returns Management Software Market Overview
Returns management software is a specialized software designed to streamline and automate the process of managing product returns in a business setting. It provides efficient tools and functionalities to handle various aspects of the return process, including initiation, tracking, documentation, and resolution. This software enables businesses to effectively manage customer returns, ensuring a smooth and hassle-free experience for both the customer and the company. It helps improve customer satisfaction by offering a seamless return process, enhancing brand loyalty, and reducing customer complaints. Returns management software offers features such as return initiation through multiple channels, automated return authorization, real-time tracking of returned items, inventory management, refund processing, and reporting and analytics. It integrates with other business systems, such as inventory management, sales, and customer relationship management (CRM), to provide a holistic view of the return process.
Market Assessment and Insights
- Asia Pacific dominated the market with 39.4% share in 2023.
- Asia Pacific is poised to grow at a CAGR of 11.2% over the forecast period.
- United States market is projected to grow at a CAGR of 9.6% over the forecast period.
- By Component, the Software segment accounted for the largest market share of 69% in 2023.
- By Deployment, the Cloud segment is anticipated to witness the fastest growth, registering a CAGR of 10.3% over the forecast period
- By Enterprise Size, the Large Enterprises segment accounted for the largest market share of 64.8% in 2023.
- The report profiles key industry players such as SAP SE, AfterShip, parcelLab, ReturnLogic, Return Rabbit, Loop Returns, United Parcel Service of America, Inc., nShift, ReverseLogix, Shipcloud GmbH, while also analyzing key developments in novel ideas, disruptive products, and innovative services that could reshape the future market and reveal emerging themes across the industry.
Source: The Insight Partners' analysis based on proprietary research, government publications, company annual reports, investor presentations, industry databases, and expert interviews.
● REPORT CUSTOMIZATION
Tailor This Report To Align With Your Specific Business Requirements
This report can be customized to align precisely with your business objectives, scope, and target markets. Customization options include tailored segmentation, geography, competitive analysis, and strategic insights to support informed decision-making.
Customize This Report →WHAT YOU CAN ADJUST
- ● Segmentations
- ● Geography
- ● Competitive Analysis
- ● Language Preferences
Returns Management Software Market: Strategic Insights
-
Get Top Key Market Trends of this report.This FREE sample will include data analysis, ranging from market trends to estimates and forecasts.
Returns Management Software Market Drivers and Opportunities
Increase in Return Rates to Favor Market
In recent years, businesses have witnessed a steady increase in return rates across various sectors. This can be attributed to changing consumer behavior, ease of online shopping, and rising customer expectations. Consumers now expect hassle-free return processes and seamless customer service. As a result, businesses are facing mounting pressure to streamline their returns management operations. As per industry reports from NRF and HubSpot in 2021, the average rate of product returns in the e-commerce sector was 18.1%. According to a blog by Mailmodo Technologies Inc., in 2022, category-wise return rates were as follows: Apparel (10.01%), Beauty (4.99%), Electronics (8.28%), Health and Wellness (4.20%), Jewelry (8.31%), and Sports & Outdoor (6.10%). According to a report released by the National Retail Federation and Appriss Retail, in 2022, consumers were expected to return over US$ 816 billion worth of retail merchandise purchased. Managing product returns efficiently is crucial for maintaining customer satisfaction, reducing costs, and optimizing operations. Returns management software plays a pivotal role in addressing the challenges posed by increasing return rates. Thus, increasing return rates drive the demand for returns management software, which, in turn, propels market growth.
Growth of the E-commerce Sector to Drive The Market
The surge in global e-commerce during the COVID-19 pandemic initially emerged as a response to the necessity of the situation. With the closure of physical retail stores, online shopping became a practical alternative as people were forced to stay indoors. According to Morgan Stanley, the share of global retail sales attributed to e-commerce increased from 15% in 2019 to 21% in 2021. Presently, it is estimated that e-commerce accounts for approximately 22% of total sales as per Morgan Stanley. The rise in e-commerce sales has surged the demand for industry services as consumers return up to 30% of the products in certain categories. This highlights the importance of effective return management processes and the need for businesses to address customer returns efficiently. Returns management software plays a crucial role in supporting the expanding e-commerce sector. The increasing online sales volumes eventually increase the number of product returns. Efficiently managing these returns is crucial for businesses to reduce costs, enhance operational efficiency, and maintain customer satisfaction.
Returns Management Software Market Report Segmentation Analysis
Key segments that contributed to the derivation of the returns management software market analysis are deployment, size, and application.
- Based on components, the market is bifurcated into solutions and services. In 2023, the solution segment held a larger share of the market.
- In terms of deployment, the market is bifurcated into on-premises and cloud. The cloud segment dominated the market in 2023.
- Based on enterprise size, the returns management software market is bifurcated into large enterprises and SMEs. The large enterprises segment dominated the market in 2023.
Returns Management Software Market Share Analysis by Geography
- The returns management software market is segmented into five major regions—North America, Europe, Asia Pacific (APAC), the Middle East & Africa (MEA), and South & Central America. North America dominated the market in 2023, followed by Europe, South & Central America, and APAC, respectively.
- The North America returns management software market is segmented into the US, Canada, and Mexico. In terms of revenue, the US dominated the returns management software market share. Several key factors drive the returns management software market in the US. The significant growth of e-commerce sales is a key driver. According to the US Department of Commerce data, E-commerce sales in the US reached ~US$ 1.119 trillion in 2023, showing a growth rate of 7.6% compared to 2022. This growth in online sales creates a greater need for efficient returns management solutions to handle the increasing volume of returns. Online retailers face a substantial revenue loss due to product returns. For instance, in 2020, the National Retail Federation (NRF) projected that e-commerce retail sales in the US reached US$ 565 billion, with US$ 102 billion worth of merchandise being returned. In 2021, the federation estimated that the overall return rate stood at 16.6%, equivalent to approximately US$ 761 billion in returned goods.
Returns Management Software Market Report Scope
| Report Attribute | Details |
|---|---|
| Market size in 2023 | US$ 1.58 Billion |
| Market Size by 2031 | US$ 3.29 Billion |
| Global CAGR (2023 - 2031) | 9.6% |
| Historical Data | 2021-2022 |
| Forecast period | 2024-2031 |
| Segments Covered |
By Component
|
| Regions and Countries Covered |
North America
|
| Market leaders and key company profiles |
|
Returns Management Software Market Players Density: Understanding Its Impact on Business Dynamics
The Returns Management Software Market is growing rapidly, driven by increasing end-user demand due to factors such as evolving consumer preferences, technological advancements, and greater awareness of the product's benefits. As demand rises, businesses are expanding their offerings, innovating to meet consumer needs, and capitalizing on emerging trends, which further fuels market growth.
Returns Management Software Market News and Recent Developments
The returns management software market is evaluated by gathering qualitative and quantitative data post primary and secondary research, which includes important corporate publications, association data, and databases. The following is a list of developments in the returns management software market:
- In January 2024, ReturnLogic, one of the leading providers of e-commerce infrastructure Software as a Service (SaaS), announced its integration with an open SaaS e-commerce platform, BigCommerce. With this collaboration, the firms introduced a new era of intelligent, data-driven returns management for serious e-commerce brands.
(Source: ReturnLogic, Press Release)
- In August 2023, ParcelLab unveiled a new product that transformed the returns, warranty, and exchange process from paper to digital. The new product, Retain, offers consumers a seamless returns experience while providing brands with flexibility and customization options to reduce costs and increase revenue.
(Source: ParcelLab, Press Release)
Returns Management Software Market Report Coverage and Deliverables
The "Returns Management Software Market Size and Forecast (2022–2030)" provides a detailed analysis of the market covering the areas mentioned below:
- Market size and forecast at global, regional, and country levels for all the key market segments covered under the scope
- Market dynamics such as drivers, restraints, and key opportunities
- Key future trends
- Detailed PEST/Porter's Five Forces and SWOT analysis
- Global and regional market analysis covering key market trends, major players, regulations, and recent market developments
- Industry landscape and competition analysis covering market concentration, heat map analysis, prominent players, and recent developments
- Detailed company profiles
Frequently Asked Questions

- Comprehensive Market Sizing and Forecast Analysis
- Detailed Segmentation Analysis
- In-Depth Market Dynamics Assessment
- Regional and Country-Level Insights
- Competitive Landscape and Company Benchmarking
- Strategic Business Intelligence
Recent Reports
Testimonials
The Insight Partners' SCADA System Market report is comprehensive, with valuable insights on current trends and future forecasts. The team was highly professional, responsive, and supportive throughout. We are very satisfied and highly recommend their services.
RAN KEDEM Partner, Reali Technologies LTDsI requested a report on a very specific software market and the team produced the report in a few days. The information was very relevant and well presented. I then requested some changes and additions to the report. The team was again very responsive and I got the final report in less than a week.
JEAN-HERVE JENN Chairman, Future AnalyticaWe worked with The Insight Partners for an important market study and forecast. They gave us clear insights into opportunities and risks, which helped shape our plans. Their research was easy to use and based on solid data. It helped us make smart, confident decisions. We highly recommend them.
PIYUSH NAGPAL Sr. Vice President, High Beam GlobalThe Insight Partners delivered insightful, well-structured market research with strong domain expertise. Their team was professional and responsive throughout. The user-friendly website made accessing industry reports seamless. We highly recommend them for reliable, high-quality research services
YUKIHIKO ADACHI CEO, Deep Blue, LLC.This is the first time I have purchased a market report from The Insight Partners.While I was unsure at first, I visited their web site and felt more comfortable to take the risk and purchase a market report.I am completely satisfied with the quality of the report and customer service. I had several questions and comments with the initial report, but after a couple of dialogs over email with their analyst I believe I have a report that I can use as input to our strategic planning process.Thank you so much for taking the extra time and making this a positive experience.I will definitely recommend your service to others and you will be my first call when we need further market data.
JOHN SUZUKI President and Chief Executive Officer, Board Director, BK TechnologiesI wish to appreciate your support and the professionalism you displayed in the course of attending to my request for information regarding to infectious disease IVD market in Nigeria. I appreciate your patience, your guidance, and the fact that you were willing to offer a discount, which eventually made it possible for us to close a deal. I look forward to engaging The Insight Partners in the future, all thanks to the impression you have created in me as a result of this first encounter.
DR CHIJIOKE ONYIA MANAGING DIRECTOR, PineCrest Healthcare Ltd.Reason to Buy
- Informed Decision-Making
- Understanding Market Dynamics
- Competitive Analysis
- Identifying Emerging Markets
- Customer Insights
- Market Forecasts
- Risk Mitigation
- Boosting Operational Efficiency
- Strategic Planning
- Investment Justification
- Tracking Industry Innovations
- Aligning with Regulatory Trends


