
UV Visible Spectroscopy Market Share, Demand & Growth by 2034
Coverage: By Type (Dual-Beam Systems, Single-Beam Systems, Array-Based Systems, Handheld Systems); Application (Industrial Applications, Physical Chemistry Studies, Life Science Studies, Environmental studies, Academic Applications, Life Science RandD, Quality Assurance/ Quality Control, Production), and Geography (North America, Europe, Asia Pacific, and South and Central America)
- Status : Data Released
- Report Code : TIPRE00016409
- Category : Electronics and Semiconductor
- No. of Pages : 150
- Available Report Formats :


- Last update date : September 15, 2026


2025 Market Size
US$ 2.69 Bn
Base year value
2034 Forecast
US$ 4.48 Bn
Projected by 2034
CAGR 2026-2034
5.80 %
Growth rate
Addressable Market
US$ 32.44 Bn
(2026-2034)
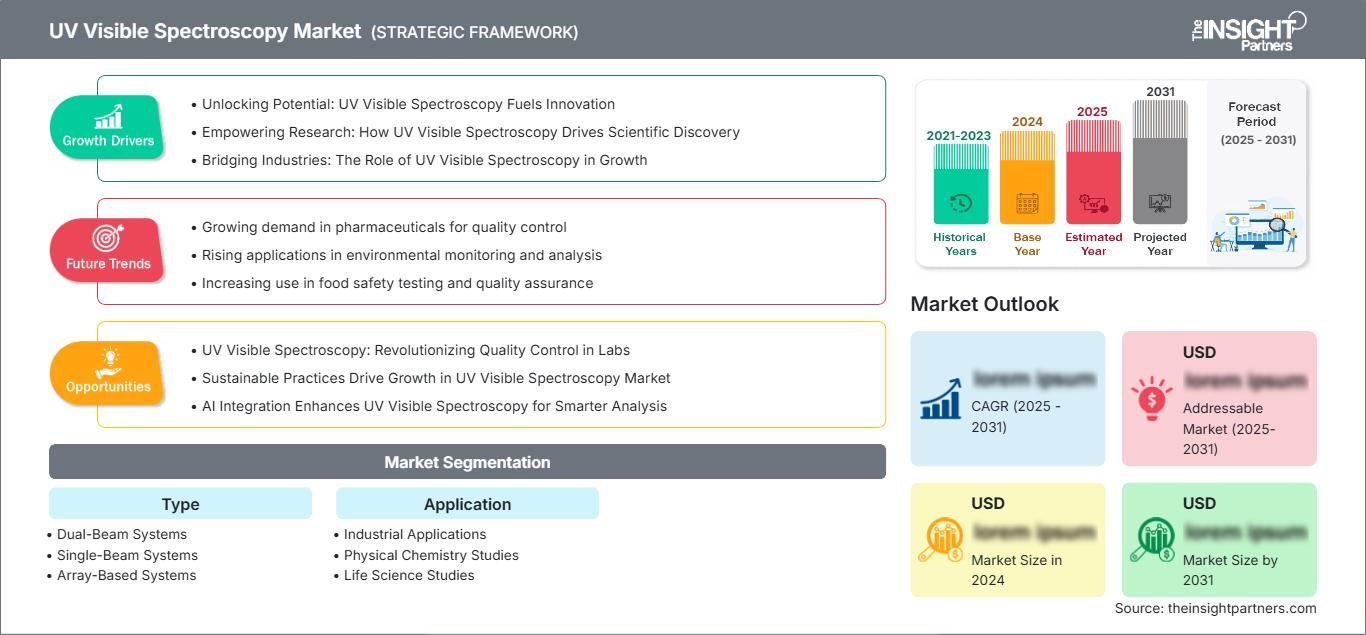
The UV visible spectroscopy market is valued at US$ 2.69 Billion in 2025 and is projected to reach US$ 4.48 Billion by 2034, expanding at a CAGR of 5.80% during 2026–2034. The market covers optical systems used to quantify absorbance, transmission, and reflectance across ultraviolet and visible wavelengths, serving laboratory research, industrial testing, environmental monitoring, and quality assurance workflows worldwide.
North America is expected to advance at a 6.1–6.5% CAGR during 2026–2034, supported by established pharmaceutical and biotechnology testing infrastructure and continued replacement of legacy laboratory instruments. The UV visible spectroscopy market size is supported by automated workflows, electronic records, and higher-throughput analytical methods in regulated laboratories.
UV Visible Spectroscopy Market Assessment and Insights
- North America: The region held a 34–38% UV visible spectroscopy market share in 2025 and is expected to grow at a 6.1–6.5% CAGR between 2026–2034, supported by pharmaceutical testing, environmental laboratories, and instrument modernization.
- US: The US represented 78–82% of North American revenue in 2025 and is projected to expand at a 6.2–6.6% CAGR between 2026–2034 as regulated laboratories upgrade analytical platforms.
- Europe: Europe accounted for a 27–31% share in 2025 and is expected to record a 5.5–5.9% CAGR between 2026–2034, led by Germany, the UK, France, Italy, and Spain across pharmaceutical, chemical, and environmental applications.
- Asia Pacific: Asia Pacific represented a 25–29% share in 2025 and is forecast to grow at a 6.2–6.8% CAGR between 2026–2034, with China, Japan, South Korea, and India benefiting from expanding laboratories and manufacturing quality systems.
- Largest Segment: Quality Assurance/Quality Control held a 20–24% market share in 2025 and is expected to grow at a 5.9–6.3% CAGR between 2026–2034, reflecting routine compliance testing.
- High Growth Segment: Handheld Systems held a 10–14% market share in 2025 and is expected to grow at a 7.4–8.0% CAGR between 2026–2034, driven by field testing and decentralized analysis.
- Key companies analyzed in detail: Agilent Technologies, Inc.; Bio-Rad Laboratories, Inc.; Bruker Corporation; Hach Company; Hitachi High-Tech Corporation; HORIBA, Ltd.; JASCO Corporation; PerkinElmer, Inc.; Shimadzu Corporation; Thermo Fisher Scientific Inc.
Source: The Insight Partners' analysis based on proprietary research, government publications, company annual reports, investor presentations, industry databases, and expert interviews.
Instrument designs are moving towards double-beam stability, rapid scan speed, micro-volume sampling, connectivity, and software-driven operation. Manufacturers are opting to integrate standard optical systems with application-specific hardware, reagents, and compliance software.
Usage can be expanded in new manufacturing centers as laboratories in the pharma, food, water, and chemical industries continue expanding their capacity. The investment should focus on automation, traceability, compact designs, compliant instruments, environmental monitoring, and laboratory upgrades.
UV Visible Spectroscopy Market Report Scope
| Report Attribute | Details |
|---|---|
| Market size in 2025 | US$ 2.69 Billion |
| Market Size by 2034 | US$ 4.48 Billion |
| Global CAGR (2026 - 2034) | 5.80% |
| Historical Data | 2021-2024 |
| Forecast period | 2026-2034 |
UV Visible Spectroscopy Market Analysis
Demand is anchored by recurring analytical requirements. Pharmaceutical and biotechnology laboratories use absorbance for concentration, nucleic acid, formulation, and release testing, while chemical and food producers verify composition and color. The ecosystem spans optics, detectors, software, consumables, service, and calibration.
Supply dynamics reflect precision optics, detectors, electronics, and software. Vendors differentiate through wavelength accuracy, low stray light, automated sampling, method libraries, and audit-ready data handling. The UV visible spectroscopy market growth is therefore linked to both instrument replacement cycles and the migration from manual measurements toward connected laboratory workflows that reduce transcription and operator variability.
Competition is broad among established analytical-instrument manufacturers. The UV-visible spectroscopy market analysis shows that service networks and application depth are important assets. Agilent Technologies Inc.'s competing technologies include Cary platforms, while Thermo Fisher Scientific Inc. has its GENESYS and NanoDrop technologies. The main selling point for the Shimadzu Corporation is the double beam. There are also additional specializations and relationships of the following manufacturers: PerkinElmer Inc., Bio-Rad Laboratories Inc., Bruker Corporation, Hitachi High-Tech Corporation, HORIBA Ltd., JASCO Corporation, and Hach Company.
The focus for investment shifts towards applications. Systems are positioned in areas such as pharmaceutical regulation, water analysis, life sciences, and decentralized analysis. Product releases are focused on sample compatibility, ease of use, connectivity, and repeatability.
● REPORT CUSTOMIZATION
Tailor This Report To Align With Your Specific Business Requirements
This report can be customized to align precisely with your business objectives, scope, and target markets. Customization options include tailored segmentation, geography, competitive analysis, and strategic insights to support informed decision-making.
Customize This Report →WHAT YOU CAN ADJUST
- ● Segmentations
- ● Geography
- ● Competitive Analysis
- ● Language Preferences
UV Visible Spectroscopy Market: Strategic Insights
Regional Insights
North America UV visible spectroscopy market
North America accounted for a 34–38% share in 2025 and is expected to expand at a 6.1–6.5% CAGR through 2034. The USA is the major regional demander, with support from pharmaceutical R&D, biotech, food testing, university labs, and environmental testing. Canada provides demand via mining, water analysis, academic research, and regulated industrial labs, and Mexico provides demand through manufacturing and quality-control facilities.
Reproducibility, electronic data, throughput, and service are key criteria for regional purchases. Replacement purchasers look more and more at microvolume sampling, automation, and connectivity software. Pharmaceutical quality systems and environmental testing provide demand, while incumbent suppliers provide service and replacement.
U.S. UV visible spectroscopy Market
The US represented 78–82% of North American revenue in 2025 and is projected to grow at a 6.2–6.6% CAGR through 2034. The lab’s built-up installation base ensures ongoing demand for replacement in the pharmaceutical industry, biotechnology, academia, and industrial quality assurance. The presence of instruments from Agilent Technologies, Inc., Thermo Fisher Scientific Inc., PerkinElmer, Inc., Bio-Rad Laboratories, Inc., and other well-established vendors helps in ensuring service and application know-how.
Growing demand includes requirements for quick, standardized measurement and documentation. Microvolume instruments are used by life-science laboratories to minimize sample consumption, while robustness is important for industrial laboratories. Method-oriented and portable instruments are preferred by environmental laboratories.
Europe UV visible spectroscopy Market
Europe held a 27–31% share in 2025 and is forecast to grow at a 5.5–5.9% CAGR through 2034. Germany is at the forefront of region-wide adoption, thanks to pharmaceuticals, chemicals, materials, and research institutions. The United Kingdom continues to be one of the largest markets for scientific instruments, whereas France, Italy, and Spain make their contribution thanks to regulated manufacturing, environmental testing, food analysis, and research. Data security, energy efficiency, and longevity have become key criteria among the region’s customers.
Germany gains from chemical and pharmaceutical manufacturing. The United Kingdom’s demand is boosted by universities, life sciences, and contract laboratories. France, Italy, and Spain add value due to food quality, environmental testing, specialty chemicals, and pharmaceuticals.
APAC UV visible spectroscopy Market
Asia Pacific represented a 25–29% share in 2025 and is expected to grow at a 6.2–6.8% CAGR through 2034, with China leading regional demand. Japan and South Korea maintain sophisticated analytical manufacturing bases, while India and Australia expand applications in pharmaceuticals, education, mining, food, and environmental laboratories.
Industrial expansion and scientific infrastructure investment support installations. China combines manufacturing and environmental demand; India benefits from pharmaceutical and academic growth; Japan and South Korea emphasize precision; Australia supports mining and environmental analysis.
Middle East & Africa UV visible spectroscopy Market
The Middle East and Africa are projected to grow at a 5.0–5.6% CAGR through 2034, with Saudi Arabia leading regional momentum. UAE laboratories support petrochemical, water, food, and healthcare testing, while South Africa has established mining, environmental, academic, and industrial applications. Rest of the MEA demand remains linked to laboratory modernization and infrastructure development.
Energy and water infrastructure create recurring analytical requirements. Saudi Arabia and the UAE are expanding industrial and laboratory capabilities, while South Africa supports mineral and environmental testing. Healthcare, education, food safety, and municipal water investments add demand.
Segmentation Analysis
Type
Type selection reflects required accuracy, throughput, sample characteristics, and operating environment. Dual-beam platforms remain favored for stable quantitative work, while single-beam systems address cost-sensitive routine testing. Array-based instruments improve simultaneous wavelength acquisition, and handheld systems extend measurement into field environments. Overall Type demand is expected to expand at a 5.6–6.1% CAGR during 2026–2034 as laboratories balance performance with workflow efficiency.
- Dual-Beam Systems: Preferred for quantitative laboratory measurements requiring strong baseline stability and repeatability, particularly in pharmaceutical, chemical, and research environments where measurement consistency supports method reliability and regulated workflows.
- Single-Beam Systems: Maintain demand in routine analysis and education because of simpler architecture, lower acquisition complexity, and suitability for laboratories performing standardized measurements with moderate throughput requirements.
- Array-Based Systems: Support faster spectral acquisition by using detector arrays, making them strategically relevant where rapid screening, multiple wavelengths, and higher sample throughput improve laboratory productivity.
- Handheld Systems: Enable decentralized measurements for environmental, industrial, and field applications, reducing the need to transport samples and supporting faster decisions where laboratory access is limited.
Application
Application demand is diversified across industrial testing, physical chemistry, life sciences, environmental analysis, academia, R&D, quality control, and production. The UV visible spectroscopy market scope expands as laboratories use the same optical platform across research and routine workflows. Application demand is projected to grow at a 6.0–6.5% CAGR during 2026–2034, supported by recurring analytical requirements and wider instrument connectivity.
- Industrial Applications: Cover chemical, food, materials, and manufacturing analysis where absorbance and transmission measurements help verify composition, color, concentration, and process consistency.
- Physical Chemistry Studies: Use spectral measurements to investigate reaction behavior, molecular interactions, kinetics, and electronic transitions, sustaining demand within research-intensive laboratory environments.
- Life Science Studies: Support biomolecule concentration, nucleic-acid analysis, protein workflows, and experimental characterization, with microvolume configurations reducing sample consumption.
- Environmental studies: Address water and wastewater testing, pollutant monitoring, and routine chemical measurements where standardized methods and portable options improve operational responsiveness.
- Academic Applications: Remain important for teaching and research because instruments provide accessible demonstrations of spectroscopy while supporting undergraduate and advanced laboratory experiments.
- Life Science RandD: Requires flexible, high-quality measurements for discovery workflows, assay development, biomolecular characterization, and method optimization across pharmaceutical and biotechnology organizations.
- Quality Assurance/ Quality Control: Represents the largest application because routine release, incoming material, process, and compliance testing create recurring instrument utilization and strong demand for standardized workflows.
- Production: Integrates analytical measurements into manufacturing quality checks, helping operators verify raw materials, intermediates, and finished products while reducing delays between production and release.
Opportunity Snapshot
| Application | Revenue Contribution (High/Medium/Low) | Trend Tag (MAX 2 words) | Adoption Stage (Emerging/Scaling/Mature) |
| Industrial Applications | High | Process Testing | Mature |
| Physical Chemistry Studies | Medium | Reaction Kinetics | Mature |
| Life Science Studies | High | Microvolume Assays | Scaling |
| Environmental studies | High | Water Monitoring | Scaling |
| Academic Applications | Medium | Teaching Labs | Mature |
| Life Science RandD | High | Biomolecule Screening | Scaling |
| Quality Assurance/ Quality Control | High | Release Testing | Mature |
| Production | High | Inline Verification | Scaling |
UV Visible Spectroscopy Market Growth Drivers and Impact Analysis
Expansion of Regulated Pharmaceutical and Biotechnology Testing
There is a need for repetitive verification through all stages of pharmaceutical and biotech manufacturing, from raw materials, intermediates, formulations, to the final product. UV-visible testing becomes desirable since the tests could be standardized, automated, and integrated into existing process flows. The investments into biologics, generic drugs, and contract manufacturing thus increase demand for quantitative instrumentation among laboratories. Beyond the initial purchase of the new instrumentation, the users of such regulated products buy other parts, like accessories, software, validation services, calibration, and replacement parts. It becomes possible for vendors to maximize lifecycle revenues by bundling the instruments with audit trails, user interface, and validated workflows.
Modernization of Environmental and Water Quality Laboratories
Water shortages, discharge limits, and increases in water treatment capabilities lead to increased analysis requirements. The use of UV-visible instruments for regular chemical analysis is justified by the availability of existing methods that can be integrated into the workflow using reagents, accessories, and computerized data processing. In addition, portability is advantageous for environmental labs. The business outcome here will be an expansion of the customer base, going beyond academic institutions to include utility companies, industries, environmental firms, and government laboratories. This gives manufacturers leverage in the form of method libraries, automation of sample handling, calibration controls, and interfacing. This leads to an industry where the value of the instruments depends more on workflow efficiency than on optics.
Integration of Automation, Connectivity, and Data Integrity
Increasingly, laboratories analyze instruments in their workflow context. Automation in sampling, analysis, method guidance, record keeping, and information transfer minimizes human interaction and increases traceability. There is also room for replacement due to the fact that older technologies do not provide the data interface and management capabilities needed by laboratories today. These trends provide a business opportunity for instruments that come with software, have an open data interface, have compliance functionality, and are remotely accessible. Connectivity might also help laboratories achieve central monitoring of multi-site operations and provide for standardization of processes and instrument usage monitoring. The key business opportunity for instrument suppliers is moving towards recurring software, service, and application revenues in addition to hardware.
UV Visible Spectroscopy Market Future Trends
Greater Adoption of Intelligent Spectral Workflows
UV visible spectroscopy market trends increasingly point toward intelligent software that guides methods, flags anomalies, and standardizes calculations. This evolution will move the value base toward instruments that are able to analyze the measurement context, manage reference standards, and maintain a full audit trail. The cloud-based laboratory structure could allow for a method library as well as monitoring of methods and performance across geographically distributed instruments. In terms of hardware, fast detectors, optical stability, and sampling accessories would help to provide short measurement cycles and handle a wide range of samples. This will be especially relevant to quality laboratories in the pharmaceutical industry and contract laboratories, which require reliable method execution by different operators.
Expansion of Compact and Decentralized Measurement Platforms
Compact and portable technologies are anticipated to become increasingly important as testing gets nearer to production facilities, water supplies, field locations, and decentralized testing labs. Enhancements in power management, robust casing, wireless capability, and easy-to-use interface could render advanced testing feasible away from traditional laboratory settings. However, this change will not negate the importance of benchtops, which will continue to be vital for high-throughput and strictly regulated testing, but rather open up new customer segments. In addition, companies could consider designing software platforms that allow for field devices and laboratory-based systems to operate on the same principles and protocols. Furthermore, the need for auxiliary products that allow for variable path length, reflectometry tests, and quick sample preparation is increasing.
UV Visible Spectroscopy Market Opportunities
Localized Manufacturing and Service Networks in Asia Pacific
Asia Pacific presents an opportunity for suppliers to combine instrument sales with localized application support, calibration, training, and service infrastructure. China, India, Japan, and South Korea offer distinct demand pools across pharmaceuticals, chemicals, food processing, electronics, universities, and environmental testing. Localized support can reduce downtime and address differences in method requirements, procurement practices, and technical staffing. Manufacturers can also establish regional application centers that demonstrate workflows for specific industries rather than selling instruments solely on specifications. Partnerships with distributors, contract laboratories, and academic institutions can accelerate adoption by creating reference sites and trained user communities. The opportunity is strongest where laboratory modernization is accompanied by new manufacturing capacity, because equipment decisions can be made during facility design rather than only when existing instruments reach the end of their service life.
Workflow Bundling for Quality and Environmental Testing
Another opportunity for UV visible spectroscopy market forecasts lies in bundling spectrophotometers with validated methods, reagents, accessories, software, and service contracts. Customers increasingly value predictable outcomes and simplified procurement, especially when laboratories handle large numbers of routine measurements. Water testing, pharmaceutical quality control, food analysis, and industrial process verification are suitable targets because each involves repeatable analytical procedures. Vendors can use workflow packages to differentiate from lower-cost standalone instruments while creating recurring demand for consumables, maintenance, and application support. Strategic bundling can also reduce implementation time for smaller laboratories that lack dedicated analytical specialists. Over time, suppliers that demonstrate lower total operating effort may gain share even when their initial instrument price is higher, provided performance, service responsiveness, and data integrity meet customer requirements.
Frequently Asked Questions

- Comprehensive Market Sizing and Forecast Analysis
- Detailed Segmentation Analysis
- In-Depth Market Dynamics Assessment
- Regional and Country-Level Insights
- Competitive Landscape and Company Benchmarking
- Strategic Business Intelligence
Recent Reports
Testimonials

The Insight Partners' SCADA System Market report is comprehensive, with valuable insights on current trends and future forecasts. The team was highly professional, responsive, and supportive throughout. We are very satisfied and highly recommend their services.
RAN KEDEM Partner, Reali Technologies LTDs
I requested a report on a very specific software market and the team produced the report in a few days. The information was very relevant and well presented. I then requested some changes and additions to the report. The team was again very responsive and I got the final report in less than a week.
JEAN-HERVE JENN Chairman, Future Analytica
We worked with The Insight Partners for an important market study and forecast. They gave us clear insights into opportunities and risks, which helped shape our plans. Their research was easy to use and based on solid data. It helped us make smart, confident decisions. We highly recommend them.
PIYUSH NAGPAL Sr. Vice President, High Beam Global
The Insight Partners delivered insightful, well-structured market research with strong domain expertise. Their team was professional and responsive throughout. The user-friendly website made accessing industry reports seamless. We highly recommend them for reliable, high-quality research services
YUKIHIKO ADACHI CEO, Deep Blue, LLC.
This is the first time I have purchased a market report from The Insight Partners.While I was unsure at first, I visited their web site and felt more comfortable to take the risk and purchase a market report.I am completely satisfied with the quality of the report and customer service. I had several questions and comments with the initial report, but after a couple of dialogs over email with their analyst I believe I have a report that I can use as input to our strategic planning process.Thank you so much for taking the extra time and making this a positive experience.I will definitely recommend your service to others and you will be my first call when we need further market data.
JOHN SUZUKI President and Chief Executive Officer, Board Director, BK Technologies
I wish to appreciate your support and the professionalism you displayed in the course of attending to my request for information regarding to infectious disease IVD market in Nigeria. I appreciate your patience, your guidance, and the fact that you were willing to offer a discount, which eventually made it possible for us to close a deal. I look forward to engaging The Insight Partners in the future, all thanks to the impression you have created in me as a result of this first encounter.
DR CHIJIOKE ONYIA MANAGING DIRECTOR, PineCrest Healthcare Ltd.Reason to Buy
- Informed Decision-Making
- Understanding Market Dynamics
- Competitive Analysis
- Identifying Emerging Markets
- Customer Insights
- Market Forecasts
- Risk Mitigation
- Boosting Operational Efficiency
- Strategic Planning
- Investment Justification
- Tracking Industry Innovations
- Aligning with Regulatory Trends




 Get Free Sample for