
Visual Computing Market Trends, Size & Forecast by 2034
Coverage: by Component (Hardware, Software); Display Platform (Interactive Whiteboard, Interactive Kiosk, Interactive Table, Interactive Video Wall, Monitor, Others); Industry (Gaming, Media and Entertainment, Healthcare, Automotive, Manufacturing, Defense and Intelligence, Others) , and Geography (North America, Europe, Asia Pacific, and South and Central America)
- Status : Data Released
- Report Code : TIPRE00012305
- Category : Electronics and Semiconductor
- No. of Pages : 150
- Available Report Formats :


- Last update date : September 22, 2026


2025 Market Size
US$ 33.46 Bn
Base year value
2034 Forecast
US$ 80.36 Bn
Projected by 2034
CAGR 2026-2034
10.22 %
Growth rate
Addressable Market
US$ 505.46 Bn
(2026-2034)
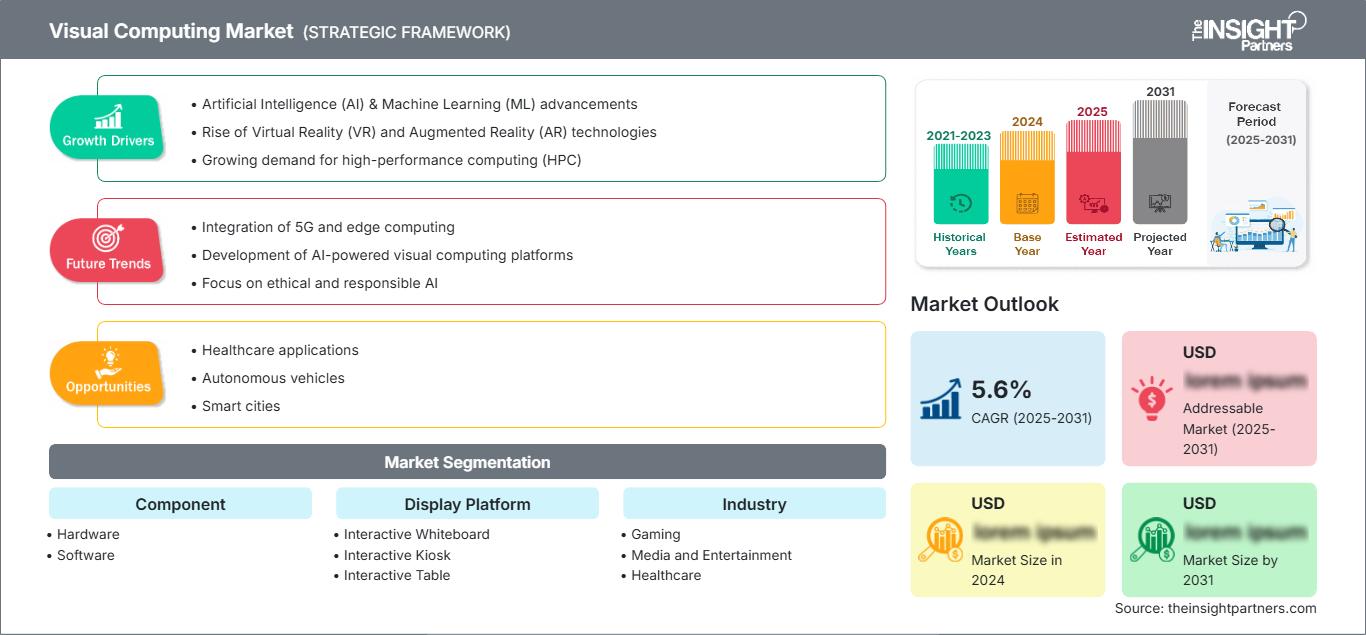
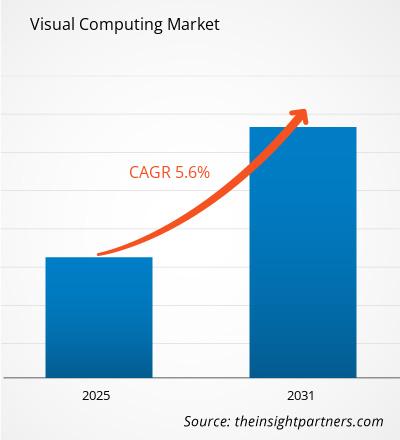
The global Visual Computing market was valued at US$ 33.46 billion in 2025 and is expected to reach US$ 80.36 billion by 2034; it is estimated to record a CAGR of 10.22% during 2026-2034.
Visual Computing Market Assessment and Insights
- North America accounted for an estimated 36–39% share in 2025 and is expected to grow at a CAGR range of 10.8–12.2% during 2026–2034, supported by GPU innovation, AI infrastructure, and enterprise visualization.
- US represented about 78–82% of North America in 2025 and is expected to grow at a CAGR range of 10.9–12.4%, led by hyperscale computing and gaming ecosystems.
- Europe held an estimated 22–25% share in 2025 and is projected to grow at 9.8–11.2% CAGR, with Germany, the UK, and France leading industrial visualization adoption.
- Asia Pacific held an estimated 27–30% share in 2025 and is expected to grow at 12.4–14.0% CAGR, supported by China, Japan, South Korea, India, and electronics manufacturing investment.
- Largest Segment: Hardware held an estimated 58–62% market share in 2025 and is projected to grow at 10.9–12.1% CAGR due to GPU, processor, and display demand.
- High Growth Segment: Software held an estimated 38–42% share in 2025 and is projected to grow at 12.3–13.8% CAGR due to simulation, AI visualization, and rendering platforms.
- Key companies analyzed in detail: NVIDIA Corporation, Intel Corporation, Advanced Micro Devices, Inc., Arm Limited, Imagination Technologies Limited, Matrox Electronic Systems Ltd., BioDigital, Inc., Exxact Corporation, Cubix Corporation, and SoftKinetic.
Source: The Insight Partners' analysis based on proprietary research, government publications, company annual reports, investor presentations, industry databases, and expert interviews.
The market has transitioned from being graphics-driven to encompassing processors, displays, AI algorithms, rendering engines, cloud-based visualization, and spatial user interface technologies. The market is expanding beyond the gaming and media production industries due to the use of visual data in the manufacturing, healthcare, automotive design, and defense simulation industries.
Future demand will be further enhanced with the transition of enterprise visualization from static to interactive, predictive, and collaborative systems. Investment in edge AI, 3D digital twins, immersive learning, and GPU-accelerated analytics is expanding the market growth opportunity across both mature and emerging economies, according to the Visual Computing Market report.
Visual Computing Market Report Scope
| Report Attribute | Details |
|---|---|
| Market size in 2025 | US$ 33.46 Billion |
| Market Size by 2034 | US$ 80.36 Billion |
| Global CAGR (2026 - 2034) | 10.22% |
| Historical Data | 2021-2024 |
| Forecast period | 2026-2034 |
Visual Computing Market Analysis
The drivers behind the growth in the market will be the increasing significance of graphics-intensive workloads in enterprise, consumer, and industrial applications. This is due to the importance of visualization tasks in enterprise productivity. Gamers need highly realistic renderings, healthcare requires accurate anatomical visualizations, manufacturing companies use simulations before production, and self-driving vehicles use computer vision. The hardware side of the supply will depend on the state of the GPU market, the roadmap of processors, memory bandwidth, and display technology, while the demand from software will come from render engines, AI-assisted visualization tools, and software for visualization.
The market analysis reveals the presence of the value chain, including semiconductor vendors, display makers, workstation vendors, cloud service providers, system integration firms, and software companies. Companies will compete through improving performance-per-watt, rendering realism, latency, compatibility, and developer ecosystems. Increasingly, the strategic positioning will depend on the capability to integrate hardware acceleration with the scalable software stack and industry-specific visualization workflows. Cloud graphics processing and remote visualization technologies will further expand the use cases of the market participants.
Competitive dynamics revolve around the innovation of graphic architecture, computing based on artificial intelligence, visualization software, and hardware ecosystems. Major players have been making investments in powerful processors, graphics technologies, and software optimization solutions in order to enhance rendering performance and user experience. Collaboration between hardware vendors, cloud computing companies, and software developers becomes more relevant as customers require end-to-end solutions that can facilitate design, simulation, analysis, content production, and immersive experience. The segment also receives impetus from the growing use of real-time rendering, extended reality applications, and artificial intelligence-based visual computing technologies.
In terms of future investments, it is predicted that the sector will be focused on AI-based graphics acceleration, edge visualization, real-time simulation, and low-power consumption computing solutions. Companies tend to look for solutions that are capable of handling complex visual workloads at a lower cost and with enhanced scalability. Developing economies present additional investment opportunities in view of the growing need for digital transformation in such industries as manufacturing, healthcare, education, retail, and media.
● REPORT CUSTOMIZATION
Tailor This Report To Align With Your Specific Business Requirements
This report can be customized to align precisely with your business objectives, scope, and target markets. Customization options include tailored segmentation, geography, competitive analysis, and strategic insights to support informed decision-making.
Customize This Report →WHAT YOU CAN ADJUST
- ● Segmentations
- ● Geography
- ● Competitive Analysis
- ● Language Preferences
Visual Computing Market: Strategic Insights
Regional Insights
North America visual computing market
North America is expected to retain the largest visual computing market share, with an estimated 36–39% share in 2025 and a CAGR range of 10.8–12.2% during 2026–2034. The region has benefited from extensive investments in AI infrastructure, high-performance computing, gaming, cloud rendering, military simulation, and medical imaging. Additional growth has been spurred by extensive use of digital twins, visualization technology, business intelligence, and immersive content creation solutions. Extensive research ecosystems, well-developed cloud infrastructure, and ongoing advances in graphics processing technology have added to the region’s market leadership.
U.S. visual computing Market
The U.S. accounted for an estimated 78–82% of North America in 2025 and is projected to grow at a CAGR range of 10.9–12.4%. The emergence of hyperscale data centers, the development of sophisticated chips, the implementation of workstations, immersive production technologies, and the testing of self-driving vehicles are driving steady demand for visualization and image processing using GPUs and AI, respectively. Other factors that are contributing to growth include the rising application of simulation software, real-time render engines, virtual production techniques, and enterprise visualization products.
Europe visual computing Market
Europe held an estimated 22–25% share in 2025 and is projected to expand at a 9.8–11.2% CAGR. Germany is the dominant player in industrial simulations and automobile visualizations, the UK in media production and AI applications, whereas France, Italy, and Spain add their expertise to the demand generated by healthcare imaging and digital manufacturing as well as government sector modernization. Industry 4.0 implementation and engineering design systems, coupled with simulation platforms, open up new avenues.
APAC visual computing Market
Asia Pacific held an estimated 27–30% share in 2025 and is forecast to grow at a 12.4–14.0% CAGR. China and South Korea provide electronics manufacturing services, Japan provides robotics and automotive visualization, India increases its capacity for software development, and Australia specializes in mining, healthcare, and defense visualization workloads. Increased investment in cloud computing infrastructure, increased adoption of artificial intelligence technologies, and increased digital transformation efforts are driving growth in demand. The region has a well-developed technology manufacturing industry and significant enterprise investments.
Middle East & Africa visual computing Market
The Middle East and Africa region is projected to grow at a 9.0–10.6% CAGR during 2026–2034. Saudi Arabia and the UAE are focusing on smart infrastructure development, digital twins, ed-tech, and media cities, whereas South Africa is promoting healthcare imaging, defense simulation, and industrial visualization applications. Increasingly, governments and companies are favoring digital modernization initiatives that require sophisticated visualization and computational technologies. Increased spending on smart cities, industrial automation, and technology-based development projects would lead to further growth opportunities in the region.
Segmentation Analysis
Component
Component segmentation includes hardware and software. The market scope is broadening as hardware performance and software intelligence become increasingly interdependent. Component-level CAGR is estimated at 11.0–12.8% during 2026–2034, driven by GPU acceleration, AI visualization engines, interactive displays, and cloud-native rendering tools.
- Hardware remains the largest segment, supported by GPUs, CPUs, specialist processors, displays, workstations, and high-bandwidth memory infrastructure used across rendering, simulation, gaming, AI training, and real-time visualization.
- Software is gaining strategic relevance through rendering engines, visualization platforms, image processing tools, computer vision frameworks, simulation software, and workflow applications used by enterprises and creators.
Display Platform
Display Platform adoption is projected to grow at 10.6–12.1% CAGR as organizations deploy interactive visualization across education, retail, healthcare, command centers, and collaborative design environments. Monitors remain essential, while kiosks, video walls, tables, and whiteboards support engagement-heavy use cases.
- Interactive Whiteboard platforms are used in education, design review, and corporate collaboration, where shared visual content improves training, planning, and decision-making.
- Interactive Kiosk systems support retail, healthcare, transport, and public-service environments where visual interfaces improve navigation, service delivery, and customer engagement.
- Interactive Table platforms are used in collaborative planning, product design, exhibitions, and command rooms requiring shared spatial or visual data interaction.
- Interactive Video Wall solutions support operations centers, media environments, defense rooms, and enterprise dashboards where large-scale visual awareness is essential.
- Monitor platforms remain the leading display category due to sustained demand from gaming, professional design, media editing, healthcare analysis, and engineering simulation.
Industry
Industry demand is projected to grow at 11.2–13.0% CAGR as visual computing becomes embedded in sector-specific applications. Gaming and media drive volume, while healthcare, automotive, manufacturing, and defense create high-value demand for precision visualization, simulation, digital twins, and training systems.
- Gaming drives strong demand for advanced GPUs, real-time ray tracing, AI-enhanced rendering, immersive displays, and latency-sensitive platforms across PC, console, and cloud gaming.
- Media and entertainment rely on visual computing for virtual production, animation, post-production, digital effects, streaming content, and interactive storytelling workflows.
- Healthcare uses visual computing for medical imaging, surgical planning, anatomy visualization, diagnostic interpretation, simulation training, and patient education platforms.
- Automotive adoption is increasing through ADAS development, autonomous driving perception, infotainment systems, design visualization, virtual prototyping, and human-machine interface testing.
- Manufacturing uses visual computing for digital twins, product design, quality inspection, robotics guidance, simulation, training, and predictive maintenance visualization.
- Defense and Intelligence applications include simulation training, surveillance visualization, mission planning, geospatial analytics, command systems, and real-time situational awareness.
Opportunity Snapshot
| Industry | Revenue Contribution | Trend Tag | Adoption Stage |
| Gaming | High | Ray Tracing | Mature |
| Media and Entertainment | High | Virtual Production | Scaling |
| Healthcare | Medium | Medical Imaging | Scaling |
| Automotive | Medium | ADAS Simulation | Scaling |
| Manufacturing | Medium | Digital Twins | Scaling |
| Defense and Intelligence | Medium | Mission Simulation | Mature |
Visual Computing Market Growth Drivers and Impact Analysis
Expansion of AI-accelerated visualization workloads
Artificial intelligence-driven rendering, computer vision, image recognition, and generative visualization have increased the processing needs for many companies. This has increased the need for GPUs, specialized processors, and memory that are capable of processing complex visuals in real-time. This trend will affect both cloud and edge computing since businesses require fast interpretation of images, videos, simulations, and other spatial information.
Rising adoption of digital twins and simulation environments
Manufacturers, auto manufacturers, infrastructure providers, and military groups are utilizing simulation to lower prototyping costs and assess risks. Digital twins rely on visual computing to simulate assets, machinery, facilities, structures, and transportation systems within an interactive virtual environment. With greater integration of sensor feeds, computer-aided design models, and artificial intelligence analysis, simulation systems are transforming into strategic planning tools.
Growth of immersive media, gaming, and professional content creation
Gaming and digital content creation will continue to drive the need for fast, responsive graphics with realistic visual effects. Requirements for such applications span the needs for hardware and software scalability. The applications have implications on consumer electronics, workstations, cloud computing infrastructure, and interactive displays, making entertainment a consistent driver of demand for visual computing technology.
Visual Computing Market Future Trends
Cloud-native visual computing platforms
The trends in visual computing are shifting towards cloud-native rendering, visualization at a distance, and a GPU as a service approach. With this kind of shift, it becomes possible for organizations to utilize graphic services without having to invest more in their local infrastructure. The engineering team, media companies, health care providers, and designers will be able to do visual work across different locations.
Spatial computing integration across enterprise workflows
The use of spatial interfaces is projected to expand from consumer-level headsets to applications in industries such as training, healthcare, retail, automobile design, and defense. Applications in visual computing will include mixed-reality interfaces, 3D collaboration, gesture interfaces, and AI-enabled environment interpretation. This trend will generate more needs for low-latency rendering, depth sensing, lightweight displays, and software solutions for integrating the physical and digital worlds.
Visual Computing Market Opportunities
Industry-specific visualization software suites
Businesses are finding it increasingly difficult to find packages that match the requirements of their business processes and not just visualization packages. The predictions of the visual computing market show great promise for products that specialize in healthcare diagnostics, automobile simulation, factory digital twin, defense mission planning, and media creation. Companies that integrate all these aspects will be better off.
Edge visualization for latency-sensitive environments
Edge deployments create opportunities where visual data must be processed near the source. Autonomous systems, smart factories, medical devices, surveillance networks, and interactive kiosks need low delay, secure processing, and reliable local inference. Companies that deliver compact, power-efficient visual computing systems with integrated software can address use cases where cloud-only architectures cannot meet performance or data governance requirements.
Frequently Asked Questions

- Comprehensive Market Sizing and Forecast Analysis
- Detailed Segmentation Analysis
- In-Depth Market Dynamics Assessment
- Regional and Country-Level Insights
- Competitive Landscape and Company Benchmarking
- Strategic Business Intelligence
Recent Reports
Testimonials

The Insight Partners provided valuable market intelligence that supported our global go-to-market strategy. Their team was professional, responsive, and attentive to our feedback, providing thoughtful analysis and helpful methodological clarifications throughout the project.
Junmo Kim Chief Financial Officer (CFO), Enertech Co., Ltd.
The Insight Partners' SCADA System Market report is comprehensive, with valuable insights on current trends and future forecasts. The team was highly professional, responsive, and supportive throughout. We are very satisfied and highly recommend their services.
RAN KEDEM Partner, Reali Technologies LTDs
I requested a report on a very specific software market and the team produced the report in a few days. The information was very relevant and well presented. I then requested some changes and additions to the report. The team was again very responsive and I got the final report in less than a week.
JEAN-HERVE JENN Chairman, Future Analytica
We worked with The Insight Partners for an important market study and forecast. They gave us clear insights into opportunities and risks, which helped shape our plans. Their research was easy to use and based on solid data. It helped us make smart, confident decisions. We highly recommend them.
PIYUSH NAGPAL Sr. Vice President, High Beam Global
The Insight Partners delivered insightful, well-structured market research with strong domain expertise. Their team was professional and responsive throughout. The user-friendly website made accessing industry reports seamless. We highly recommend them for reliable, high-quality research services
YUKIHIKO ADACHI CEO, Deep Blue, LLC.
This is the first time I have purchased a market report from The Insight Partners.While I was unsure at first, I visited their web site and felt more comfortable to take the risk and purchase a market report.I am completely satisfied with the quality of the report and customer service. I had several questions and comments with the initial report, but after a couple of dialogs over email with their analyst I believe I have a report that I can use as input to our strategic planning process.Thank you so much for taking the extra time and making this a positive experience.I will definitely recommend your service to others and you will be my first call when we need further market data.
JOHN SUZUKI President and Chief Executive Officer, Board Director, BK Technologies
I wish to appreciate your support and the professionalism you displayed in the course of attending to my request for information regarding to infectious disease IVD market in Nigeria. I appreciate your patience, your guidance, and the fact that you were willing to offer a discount, which eventually made it possible for us to close a deal. I look forward to engaging The Insight Partners in the future, all thanks to the impression you have created in me as a result of this first encounter.
DR CHIJIOKE ONYIA MANAGING DIRECTOR, PineCrest Healthcare Ltd.Reason to Buy
- Informed Decision-Making
- Understanding Market Dynamics
- Competitive Analysis
- Identifying Emerging Markets
- Customer Insights
- Market Forecasts
- Risk Mitigation
- Boosting Operational Efficiency
- Strategic Planning
- Investment Justification
- Tracking Industry Innovations
- Aligning with Regulatory Trends





 Get Free Sample for