资产完整性管理市场增长、规模、份额、趋势、关键参与者分析及 2030 年预测
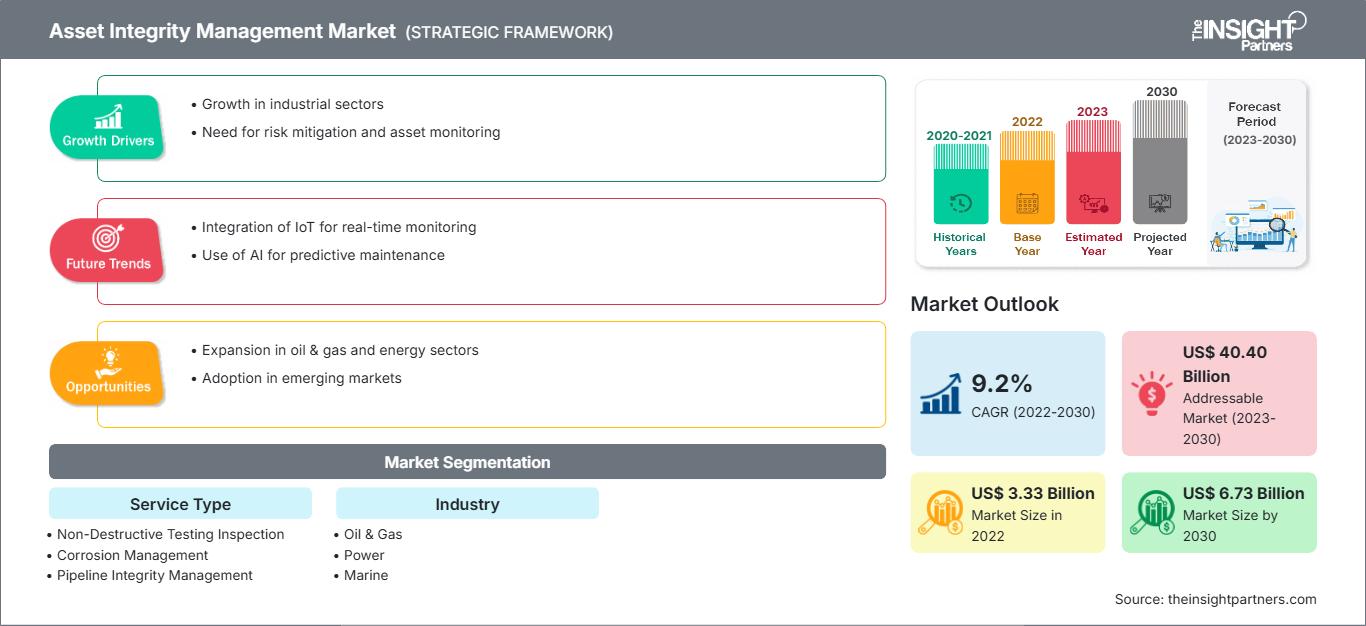
历史数据 : 2020-2021 | 基准年 : 2022 | 预测期 : 2023-2030资产完整性管理市场规模和预测(2020-2030 年)、全球和区域份额、趋势和增长机会分析报告范围:按服务类型[无损检测 (NDT) 检查、腐蚀管理、管道完整性管理、结构完整性管理、基于风险的检查 (RBI) 等] 和行业(石油和天然气、电力、海洋、采矿、航空航天等)
- 状态 : 已发布
- 报告代码 : TIPTE00002618
- 类别 : 科技、媒体和电信
- 页数 : 129
- 可用报告格式 :


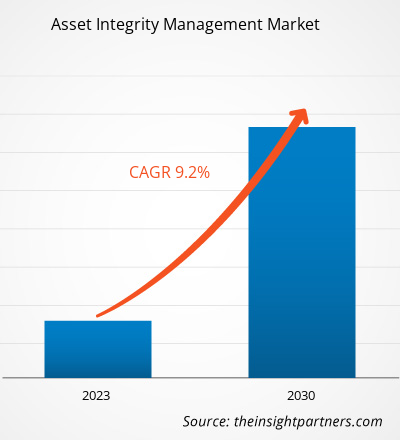
[研究报告] 2022 年资产完整性管理市场价值为 33.3 亿美元,预计到 2030 年将达到 67.3 亿美元;预计 2022 年至 2030 年的复合年增长率为 9.2%。资产完整性管理市场趋势包括将 IIoT 与资产完整性管理解决方案相结合。
分析师观点:
资产完整性管理市场预测可以帮助该市场的利益相关者规划其增长战略。资产完整性管理系统与任何资产活动(例如治理和监控)相联系,以维持公司的成功运营,同时最大限度地降低危险和风险。风险型行业对老化资产运营安全的需求不断增长,这推动了资产完整性管理市场的发展。
石油和天然气、采矿和电力行业资产的运营效率被认为是最重要的;因此,定期维护这些资产对于获得最大生产力至关重要。化学品和油气产品具有腐蚀性和易燃性,因此需要对设备进行持续检查和维护,以确保整体运行效率和安全性。此外,随着石油和天然气需求的增加以及多个国家电力工业的增长,石油和天然气行业的扩张预计将在预测期内为资产完整性管理市场的增长创造若干机会。
随着各行各业数字化转型的兴起,石油和天然气行业在全球工业革命和经济增长中发挥着关键作用。推动该行业发展的主要因素是人口快速增长导致对电力、汽车和飞机的需求旺盛。由于现有石油储量的枯竭,预计全球石油供应将迅速增加,以满足能源需求的增长。根据国际能源署 (IEA) 的数据,截至 2023 年 6 月,由于石化和航空业的巨大需求,预计 2022 年至 2028 年间全球石油需求将增长 6%,达到 1.057 亿桶/日。因此,石化和航空业对石油和天然气的需求增长也推动了石油和天然气行业的发展,促进了资产完整性管理市场份额的扩大。
自定义此报告以满足您的要求
您将免费获得任何报告的定制,包括本报告的部分内容,或国家级分析、Excel 数据包,以及为初创企业和大学提供超值优惠和折扣
资产完整性管理市场: 战略洞察
-
获取本报告的主要市场趋势。这个免费样本将包括数据分析,从市场趋势到估计和预测。
资产完整性管理市场概览:
资产完整性管理是一种资产管理标准,侧重于保护设备、健康和环境。它能够有效且高效地维持资产的持续运转,并具有诸多优势,包括降低风险、提高可靠性、增强安全性以及改善环境绩效。它通常用于石油和天然气、采矿、航空航天和其他行业。
预计资产完整性管理市场将在未来几年实现增长。这归因于多种因素,包括风险型行业对老化资产运营安全需求的增加以及政府主导的严格安全法规。此外,石油和天然气行业的扩张以及对石油和天然气需求的增长,预计将在未来几年为市场参与者创造增长机会。然而,非增值维护和资产不当操作所涉及的成本阻碍了资产完整性管理市场的增长。
资产完整性管理市场驱动因素:
风险型行业对老化资产运营安全的需求增加
资产完整性管理软件可保护资产有效执行其功能的能力,并管理公司资产以获取盈利能力。资产完整性管理软件提供各种服务,包括设计、检查、维护和运营,这些服务对基础设施和设备的完整性影响很大。它还提供审计、检查、整体质量流程和其他工具,以有效地管理资产的完整性。石化、石油和天然气、可再生能源、电力和基础设施等行业选择这些服务来提高生产力,同时满足环境和安全问题。这些行业是基于风险和高度基于资产的;因此,对此类资产的维护和检查至关重要。在石油和在天然气行业,性能和运营风险水平取决于整个价值链中资产的完整性,例如海底设备、平台上部结构、天然气处理厂、管道、炼油厂、压缩机和天然气配送网络。在石油天然气、采矿和电力行业,资产的运营效率至关重要;因此,定期维护这些资产对于实现生产力最大化至关重要。因此,借助资产完整性管理解决方案来确保运营安全的必要性正在推动资产完整性管理市场的发展。化学品和石油天然气产品具有腐蚀性和易燃性,需要对设备进行持续的检查和维护,以确保整体运营效率和安全性。资产完整性管理服务可确保提高设备的可靠性、生产力和安全性,从而持续实现高质量性能。全球各地的各种市场参与者都在提供资产完整性管理软件来管理性能和运营风险。例如,DNV Group AS 提供的 Synergi 资产完整性软件套件提供了一个核心平台,以支持石油天然气等基于风险的行业中有效的基于风险的完整性管理。因此,风险型行业对老化资产的运营安全需求是资产完整性管理市场规模不断扩大的因素之一。
细分分析:
资产完整性管理市场分为服务类型和行业。根据服务类型,市场细分为无损检测 (NDT) 检查、腐蚀管理、管道完整性管理、结构完整性管理、基于风险的检查 (RBI) 等。根据行业,市场细分为石油和天然气、电力、海洋、采矿、航空航天等。
区域分析:
资产完整性管理市场
报告包括北美、欧洲、亚太地区、中东和非洲以及南美和中美洲。就收入而言,北美占据了资产完整性管理市场份额的主导地位。北美资产完整性管理市场细分为美国、加拿大和墨西哥。在过去几年中,这三个国家都见证了资产完整性管理服务的采用率不断提高。石油天然气、化工、电力和自然资源行业依赖专有基础设施来运营,而这些基础设施正在快速老化,增加了故障风险。在石油天然气行业,大多数成熟油田的基础设施都较为陈旧,这会导致腐蚀、结垢、井设备损坏以及其他井完整性问题。这些问题增加了公司和公用事业的运营风险,需要在基础设施升级项目中投入更多资金。北美的石油天然气行业需要遵守多项政府政策和法规,以保护环境、保存文化资源并保障工人的健康和安全。该地区的上游和中游基础设施规模庞大。
美国是最大的石油和天然气生产国,其业务涉及勘探、精炼和运输。此外,美国的钻井人员新增了石油钻井平台,使石油钻井平台总数达到 862 个。美国拥有超过 250 万公里的石油和天然气管道,而加拿大拥有约 80 万公里的管道。由于其庞大且老化的基础设施,北美很可能在预测期内占据市场主导地位。此外,美国拥有一些世界上最古老的发电系统。美国是世界领先的能源生产国,水力压裂和水平钻井技术帮助该国提高了能源产量。因此,严格的政府法规和庞大的天然气管道网络预计将为各行各业增加资产完整性管理的采用创造机会,这可能会推动北美资产完整性管理市场的增长。
主要参与者分析:
资产完整性管理市场分析基于主要参与者的年度业绩,例如 SGS AG、Intertek Group plc、Aker Solutions ASA、Bureau Veritas SA、Fluor Corporation、DNV GL AS、John Wood Group PLC、Oceaneering International, Inc.、Rosen Group 和 Cybernetix SA。还分析了其他几个重要的资产完整性管理市场参与者,以全面了解市场及其生态系统。资产完整性管理市场报告强调了推动市场发展的关键因素和知名参与者的发展。
资产完整性管理市场区域洞察
The Insight Partners 的分析师已详尽阐述了预测期内影响资产完整性管理市场的区域趋势和因素。本节还讨论了北美、欧洲、亚太地区、中东和非洲以及南美和中美洲的资产完整性管理市场细分和地域分布。
资产完整性管理市场报告范围
| 报告属性 | 细节 |
|---|---|
| 市场规模 2022 | US$ 3.33 Billion |
| 市场规模 2030 | US$ 6.73 Billion |
| 全球复合年增长率 (2022 - 2030) | 9.2% |
| 历史数据 | 2020-2021 |
| 预测期 | 2023-2030 |
| 涵盖的领域 |
By 服务类型
|
| 覆盖地区和国家 |
北美
|
| 市场领导者和主要公司简介 |
|
资产完整性管理市场参与者密度:了解其对业务动态的影响
资产完整性管理市场正在快速增长,这得益于终端用户需求的不断增长,而这些需求的驱动因素包括消费者偏好的演变、技术进步以及对产品优势的认知度的提升。随着需求的增长,企业正在扩展其产品线,不断创新以满足消费者需求,并抓住新兴趋势,从而进一步推动市场增长。
- 获取 资产完整性管理市场 主要参与者概述
资产完整性管理市场中的公司专注于无机和有机战略来促进业务增长。以下列出了上述资产完整性管理市场参与者的一些近期关键市场动态:
- 2023年5月,SGS参加了在阿联酋阿布扎比举行的中东资产完整性管理会议暨展览会 (AIMCS)。此次活动由阿布扎比国家石油公司 (ADNOC) 天然气处理部门担任技术主席。超过300位行业专家和专业人士受邀探讨资产完整性管理的最新趋势和最佳实践。
- 2021年3月,福陆公司旗下的Stork与Chrysaor Holdings Limited签订了一份为期两年的续约合同,将在英国提供海上综合专业资产完整性服务。该公司将继续通过这份合同为北海中部的Armada、Everest和Lomond平台提供全面的资产管理解决方案和能力,以延长海上资产的生命周期。

Ankita 是一位充满活力的市场研究和咨询专家,在科技、媒体、信息通信技术 (ICT) 以及电子和半导体领域拥有超过 8 年的经验。她成功领导并完成了 100 多项咨询和研究项目,服务对象包括微软、甲骨文、NEC Corporation、SAP、毕马威和 Expeditors International 等全球客户。她的核心能力包括市场评估、数据分析、预测、战略制定、竞争情报和报告撰写。
Ankita 擅长处理完整的项目周期——从售前的方案设计和客户洽谈,到售后提供切实可行的洞察。她擅长管理跨职能团队、构建复杂的研究模块,并根据客户特定的业务目标调整解决方案。她卓越的沟通能力、领导能力和演讲能力使她能够在快速变化的市场环境中持续提供价值驱动的成果。
- 历史分析(2 年)、基准年、预测(7 年)及复合年增长率
- PEST和SWOT分析
- 市场规模、价值/数量 - 全球、区域、国家
- 行业和竞争格局
- Excel 数据集
客户评价
Insight Partners 的 SCADA 系统市场报告内容全面,对当前趋势和未来预测提供了宝贵的见解。该团队始终高度专业、响应迅速且乐于助人。我们非常满意,强烈推荐他们的服务。
兰·凯德姆 伙伴, Reali Technologies LTD我请求一份关于特定软件市场的报告,团队在几天内就完成了。报告信息非常相关,而且呈现得非常出色。之后,我请求对报告进行一些修改和补充。团队再次迅速响应,不到一周我就收到了最终报告。
让-埃尔韦·詹恩 主席, 未来分析公司我们与 Insight Partners 合作进行了一项重要的市场研究和预测。他们清晰地洞察了机遇和风险,帮助我们制定了计划。他们的研究简单易用,数据可靠,帮助我们做出了明智而自信的决策。我们强烈推荐他们。
皮尤什·纳格帕尔 高级副总裁, 远光全球Insight Partners 凭借其深厚的行业专业知识,提供了富有洞察力、结构合理的市场研究。他们的团队始终专业且响应迅速。用户友好的网站让访问行业报告变得顺畅无阻。我们强烈推荐他们可靠、高质量的研究服务。
安达幸彦 首席执行官, 深蓝有限责任公司这是我第一次从The Insight Partners购买市场报告。起初我有些犹豫,但访问了他们的网站后,我更放心地冒险购买市场报告。我对报告的质量和客户服务非常满意。我对最初的报告有一些疑问和意见,但在与他们的分析师通过电子邮件沟通了几次后,我相信这份报告可以作为我们战略规划流程的参考。非常感谢您抽出宝贵的时间,让这次体验如此愉快。我一定会向其他人推荐你们的服务,当我们需要更多市场数据时,你们将是我的首选。
约翰·铃木 总裁兼首席执行官、董事会董事, BK科技感谢您在处理我关于尼日利亚传染病体外诊断市场信息请求的过程中所展现的支持和专业精神。感谢您的耐心、指导,以及您愿意提供的折扣,最终促成了这笔交易。我期待未来与 Insight Partners 继续合作,这一切都要归功于您与我初次接触后留下的良好印象。
奇吉奥克博士 ONYIA 董事总经理, PineCrest 医疗保健有限公司购买理由
- 明智的决策
- 了解市场动态
- 竞争分析
- 客户洞察
- 市场预测
- 风险规避
- 战略规划
- 投资论证
- 识别新兴市场
- 优化营销策略
- 提升运营效率
- 顺应监管趋势


 获取免费样品 - 资产完整性管理市场